As you may recall, we launched the TNMT Market Index in early 2022. The TNMT Market Index is a specialized market index that tracks leading companies in the Travel and Mobility Tech industry. This index was created to provide industry professionals with a comprehensive overview of the performance of major players in this space, helping them stay abreast of important market movements.
The TNMT Market Index is unique in that it focuses specifically on companies that are shaping the future of travel and mobility through technology, like businesses involved in areas such as ride-sharing, accommodations, and travel booking platforms. These are comprised of Airbnb, Uber, HomeToGo, Joby Aviation, Sonder, Vacasa, Virgin Galactic, and more than 30 other tech companies that aim to disrupt today’s travel and mobility incumbents.
In order to gain a comprehensive understanding of the latest market trends in the Travel and Mobility Tech industry, we recently conducted an in-depth analysis of the TNMT Market Index, focusing on market movements during the first quarter of 2023.
Here’s what we found out.
2023 started off extremely well
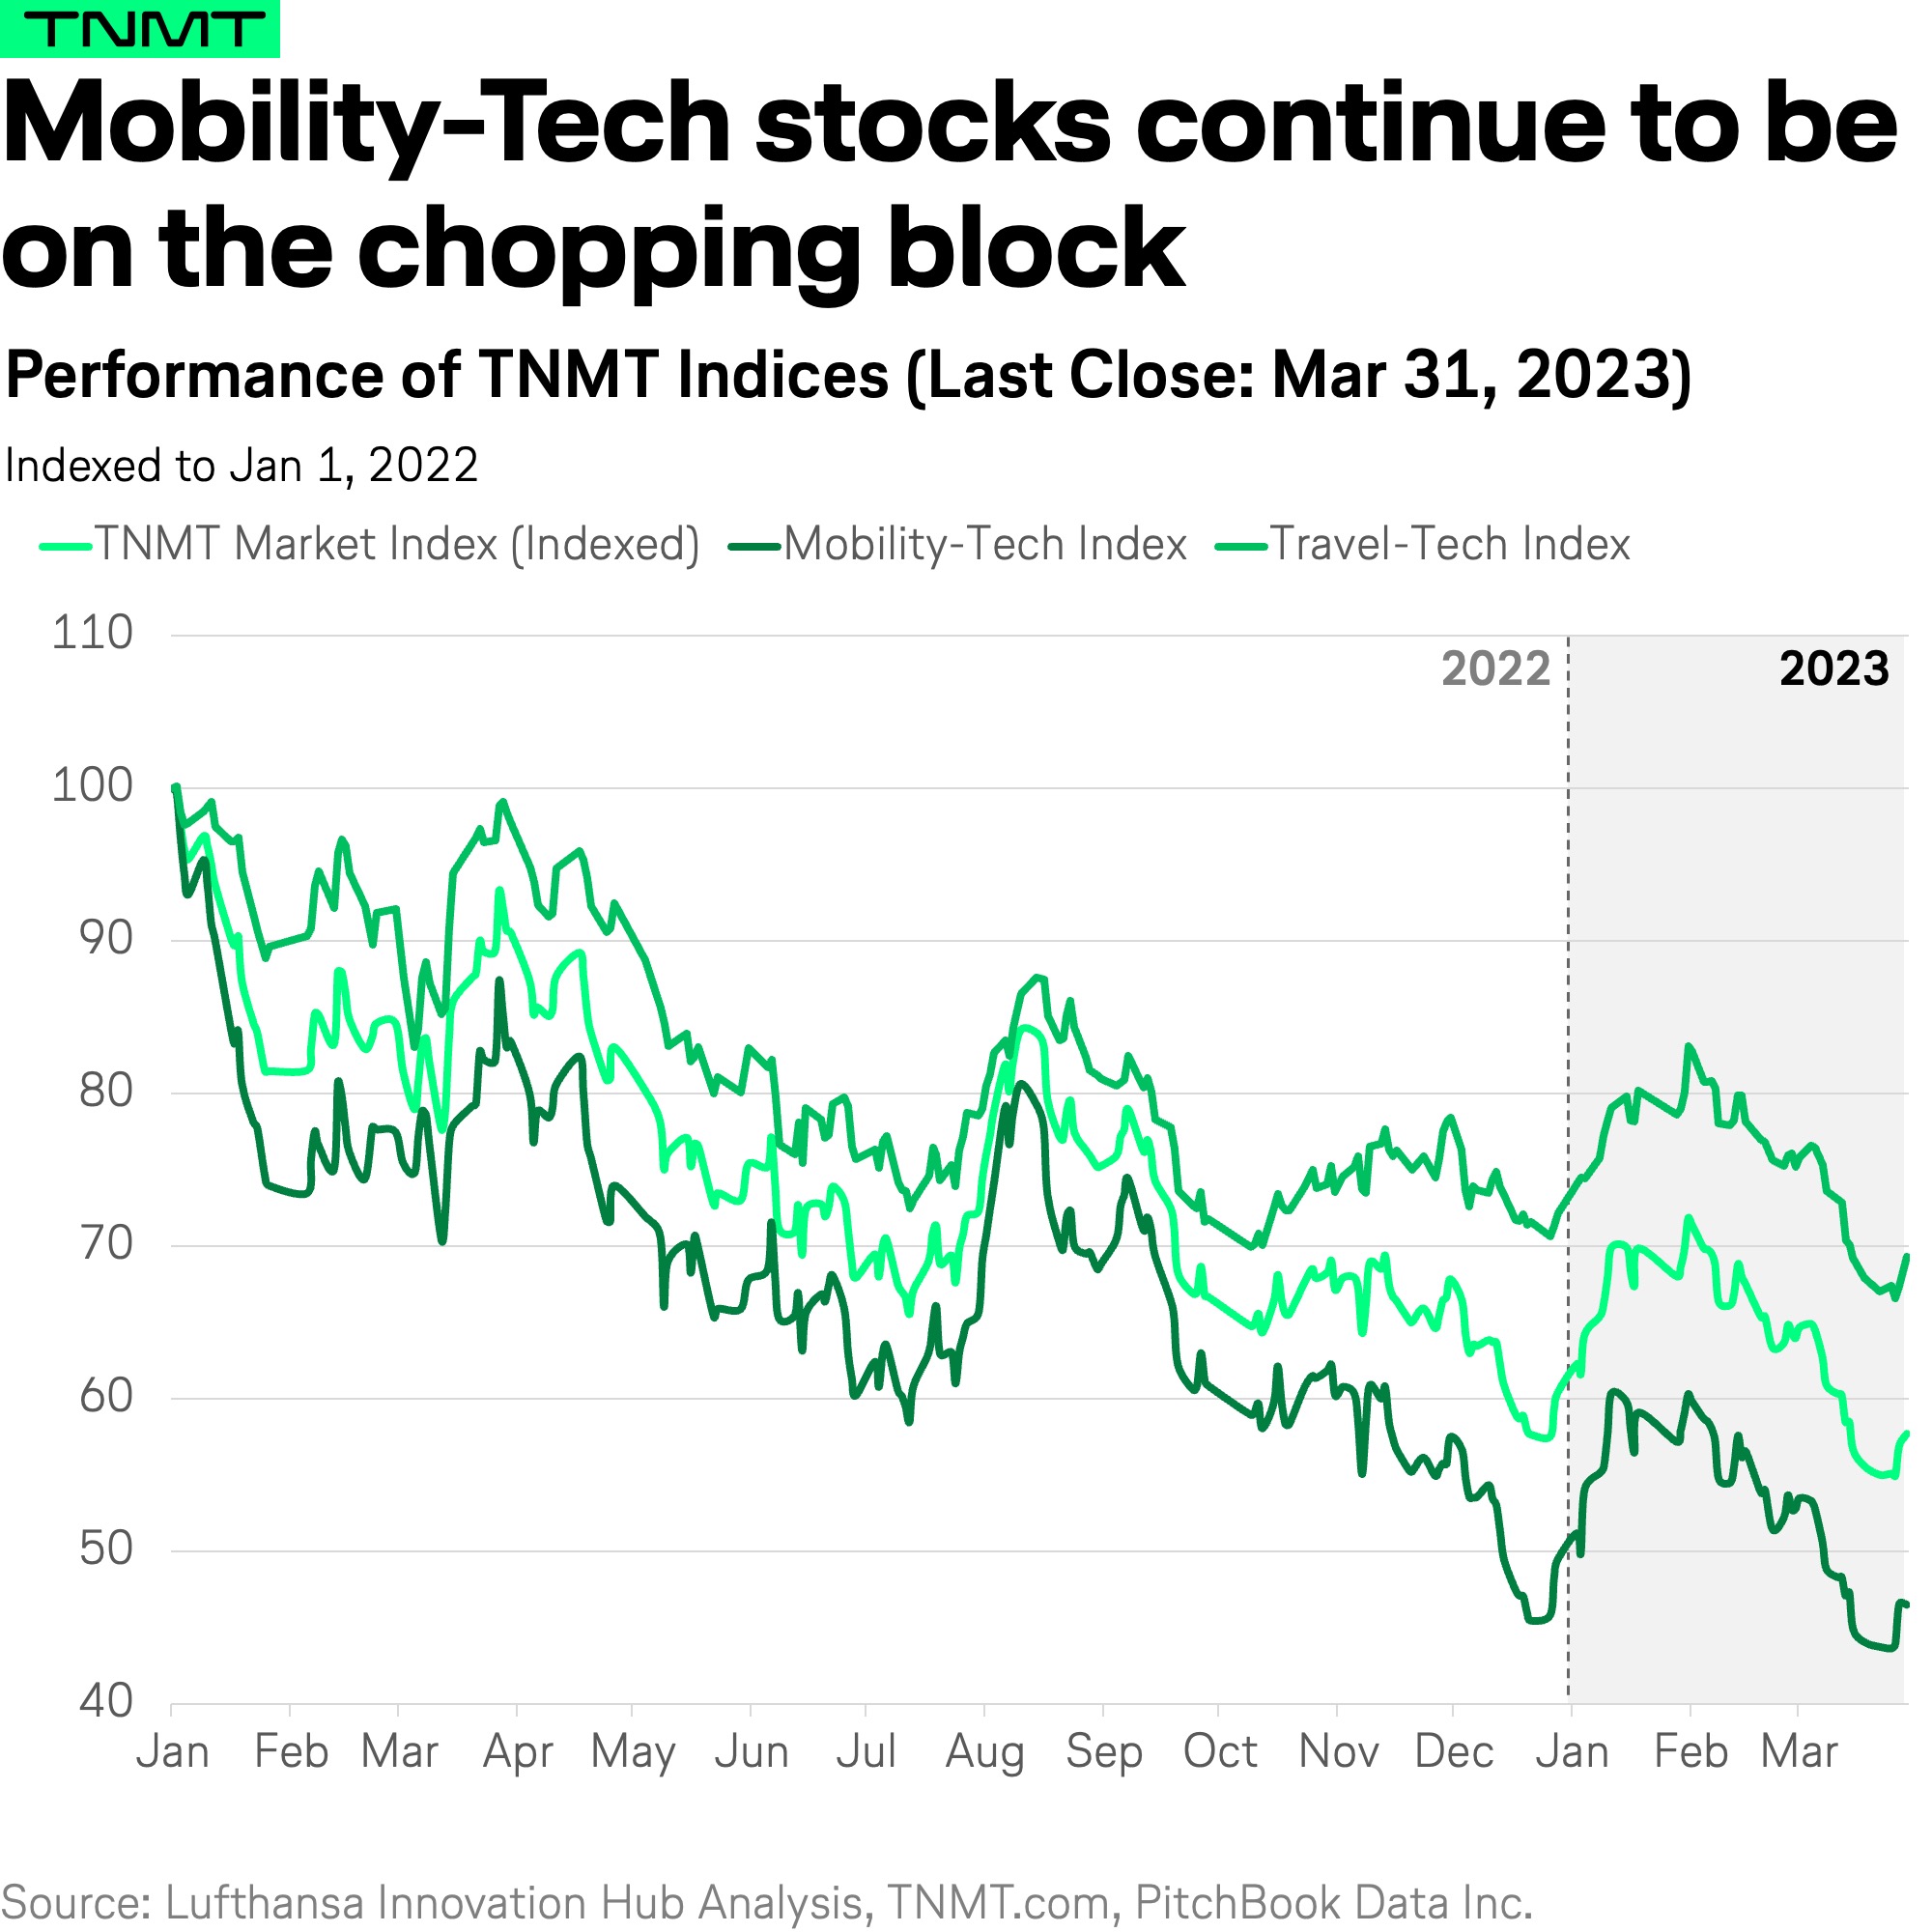
2022 was a dismal year for stock markets in general. Reportedly, the S&P 500 recorded its highest losses since the 2008 financial crisis. Despite, or perhaps because of this abysmal performance, 2023 started off with more positive momentum. The S&P 500 gained approximately 7% in value up until early February.
During this time, the TNMT Market Index also saw a veritable hike, up from 62 points in early January to close to 72 in early February (up 16%). And while this performance surely relates to Wall Street getting more comfortable with accepting rising interest rates, other industry-specific factors impacted this momentum too. After all, the TNMT Market Index outperformed the broader stock market in the first four weeks of 2023.
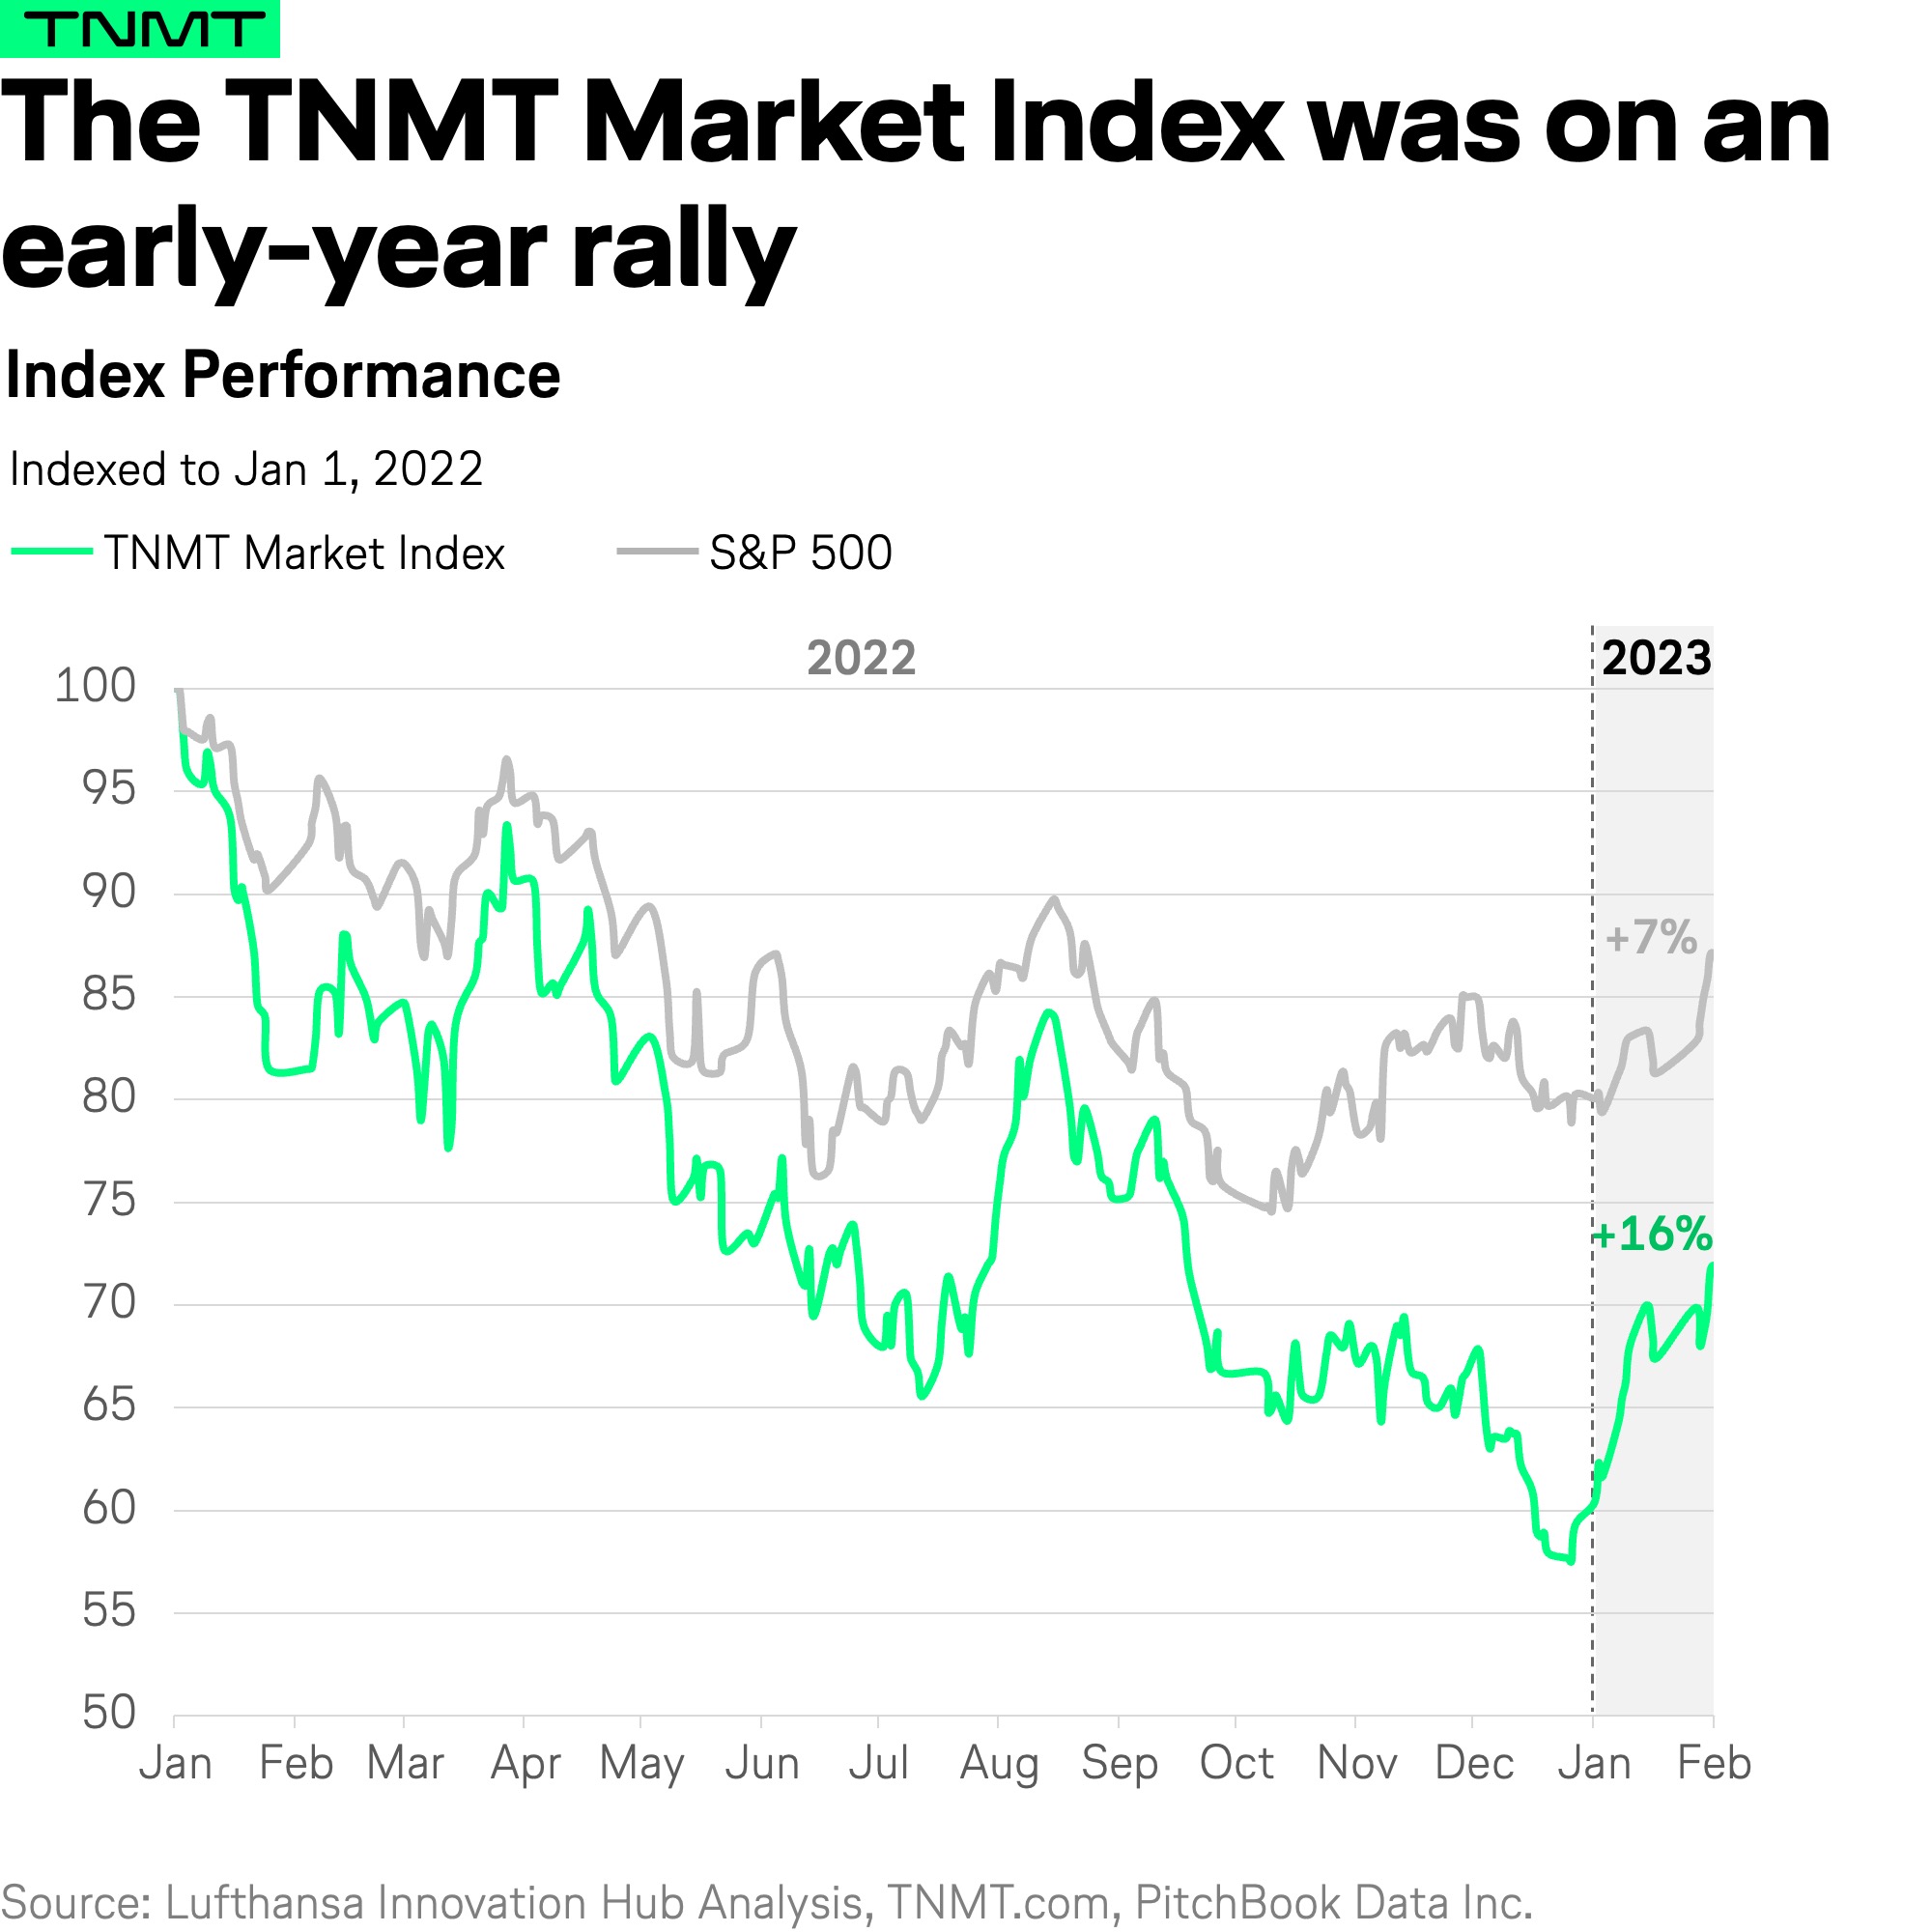
This early-year rally among TNMT stock relates to essentially two factors:
- Firstly, Asia’s reopening has had a measurable impact on the performance of stocks from the region (more on that below). This is something that we’re already seeing in another level of continuity between 2022 and 2023.
- Secondly, despite all of the macroeconomic challenges the travel industry experienced in 2022, it was the year the world reopened post-COVID. And this means many travel companies could capitalize off of the pent-up travel demand, which is shown in their annual and quarterly results for 2022—something we will also discuss in more detail below.
From February on, things turned sour
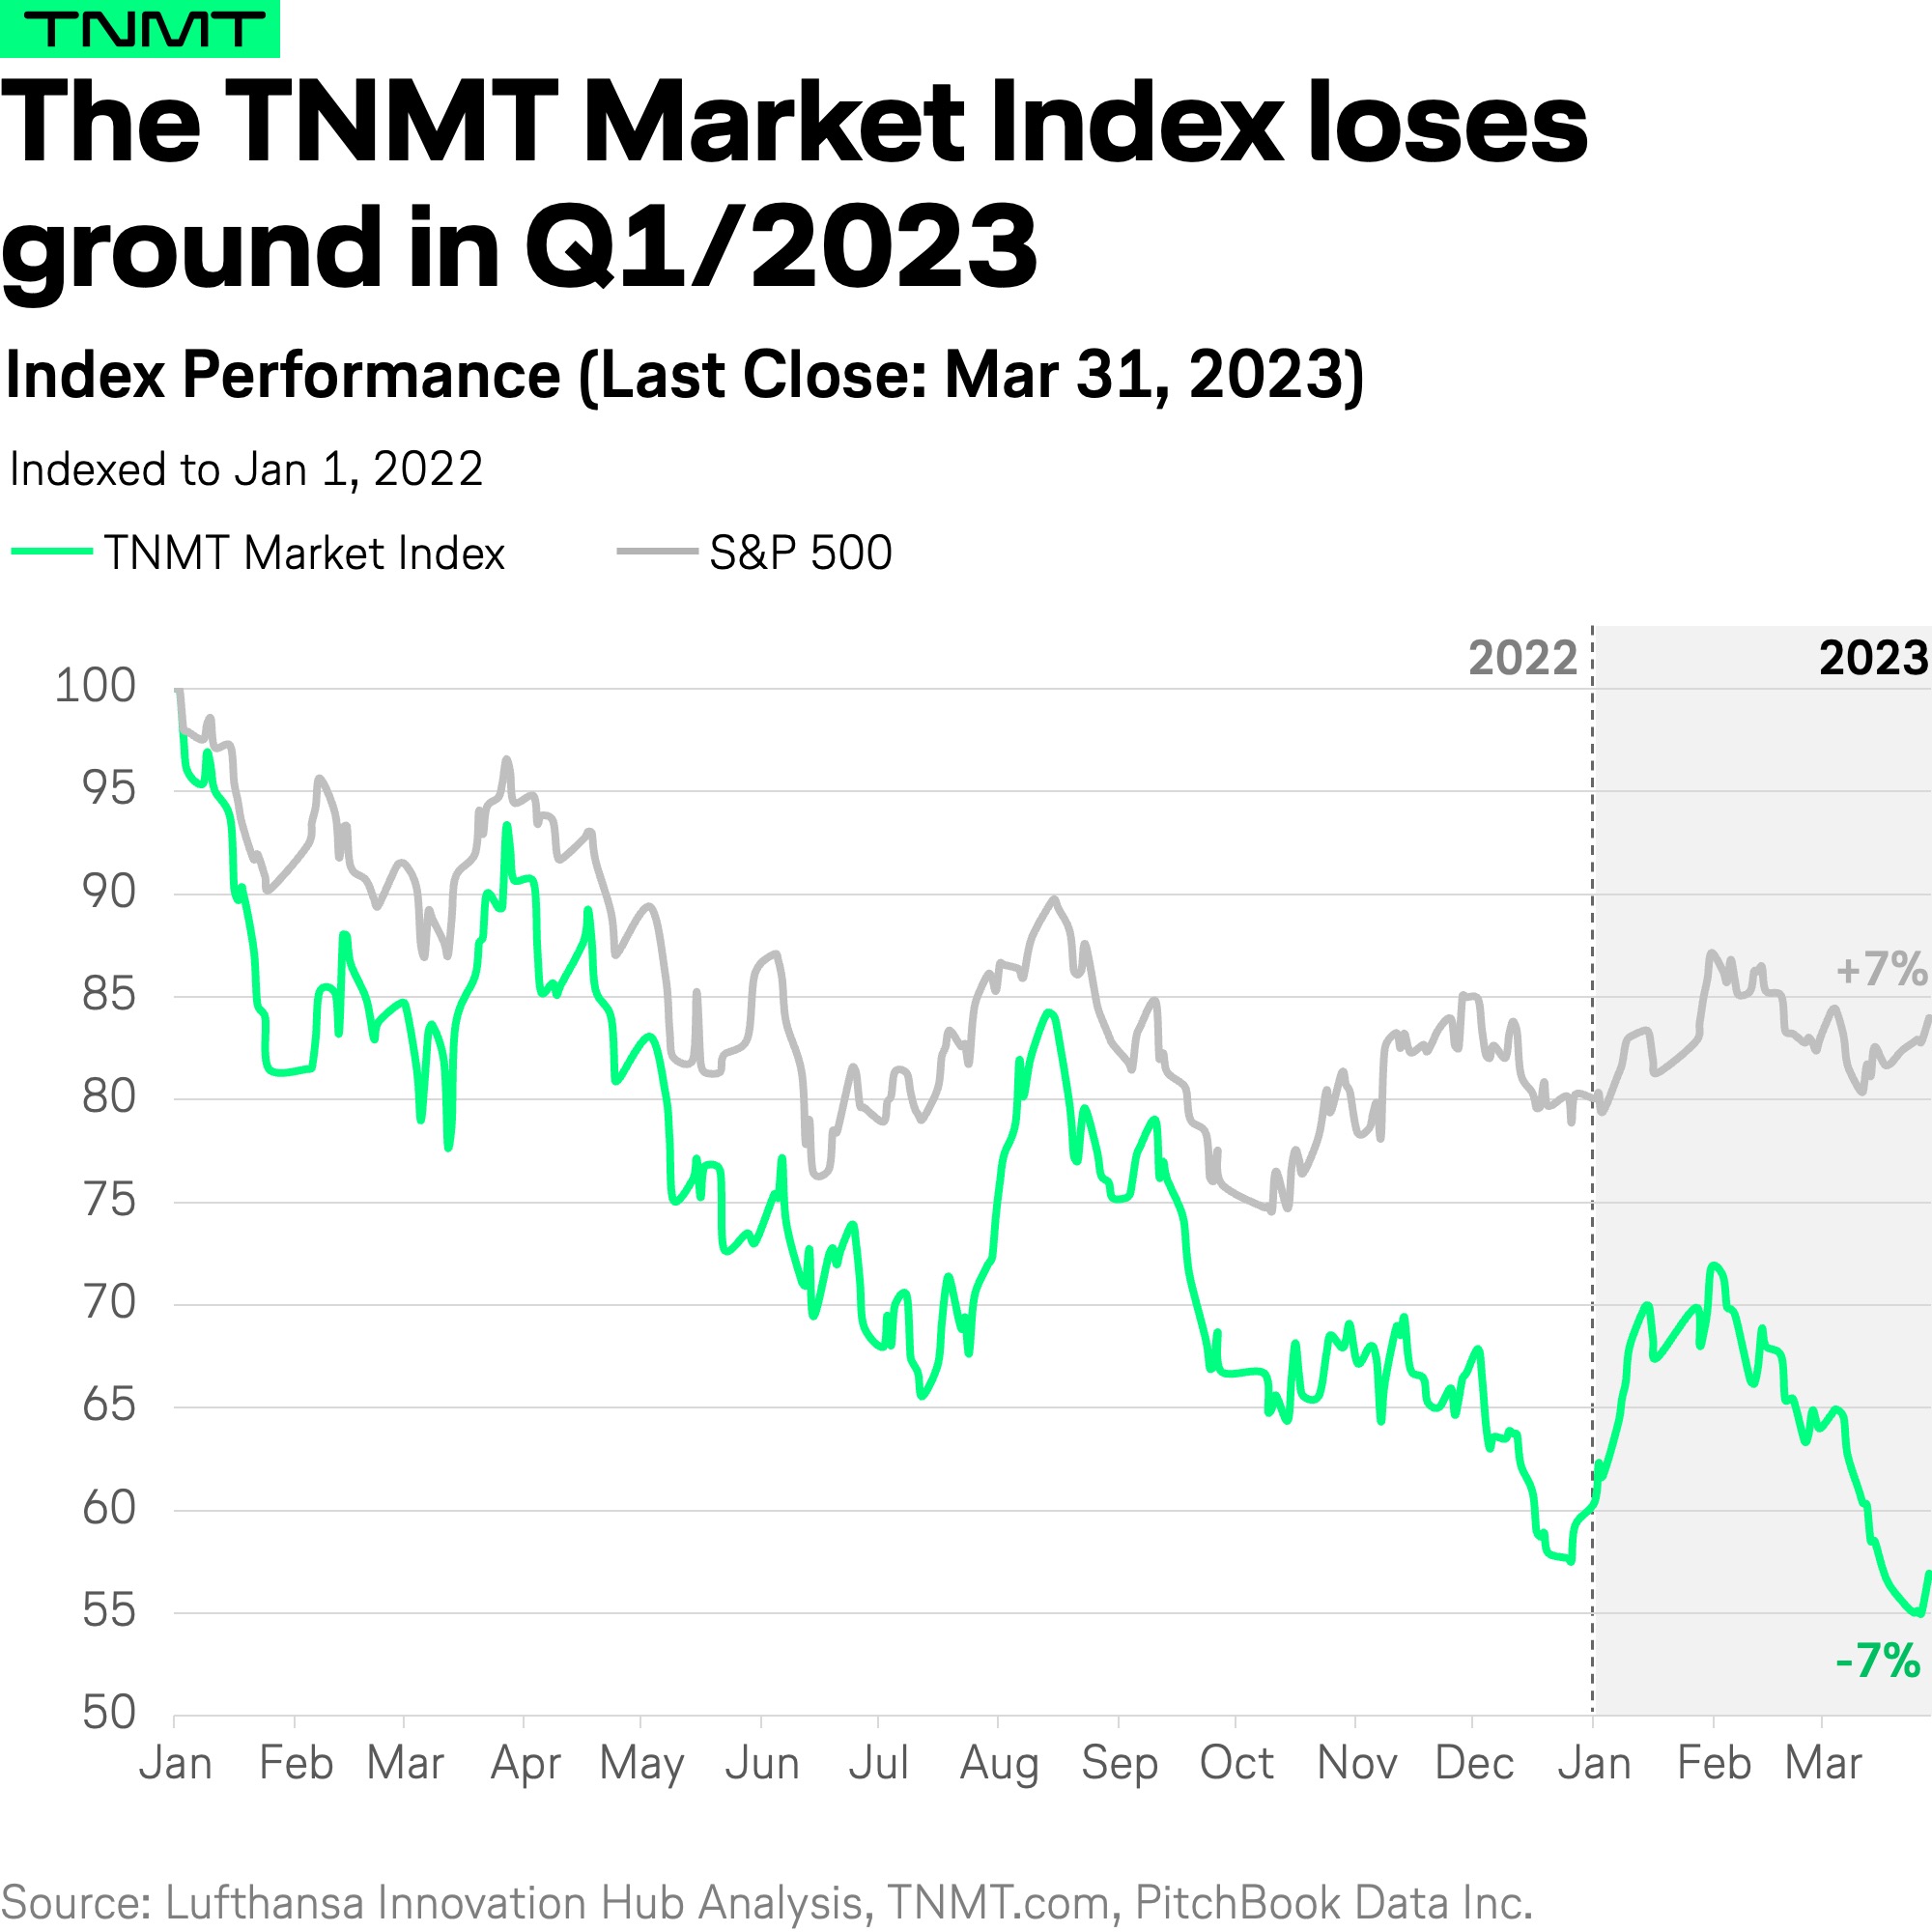
Despite this veritable rally to start off the year, the TNMT Market Index is down more than 7% in the YTD comparison as of March 31, 2023; see chart below.
How come?
This underperformance relates to the same factors as last year’s continuous TNMT downs, specifically, A) the underperforming of our industry’s SPAC contenders and B) the Mobility-Tech companies, which consistently perform way below their Travel-Tech peers.
For a closer look, check out the full TNMT Market Index Dashboard.
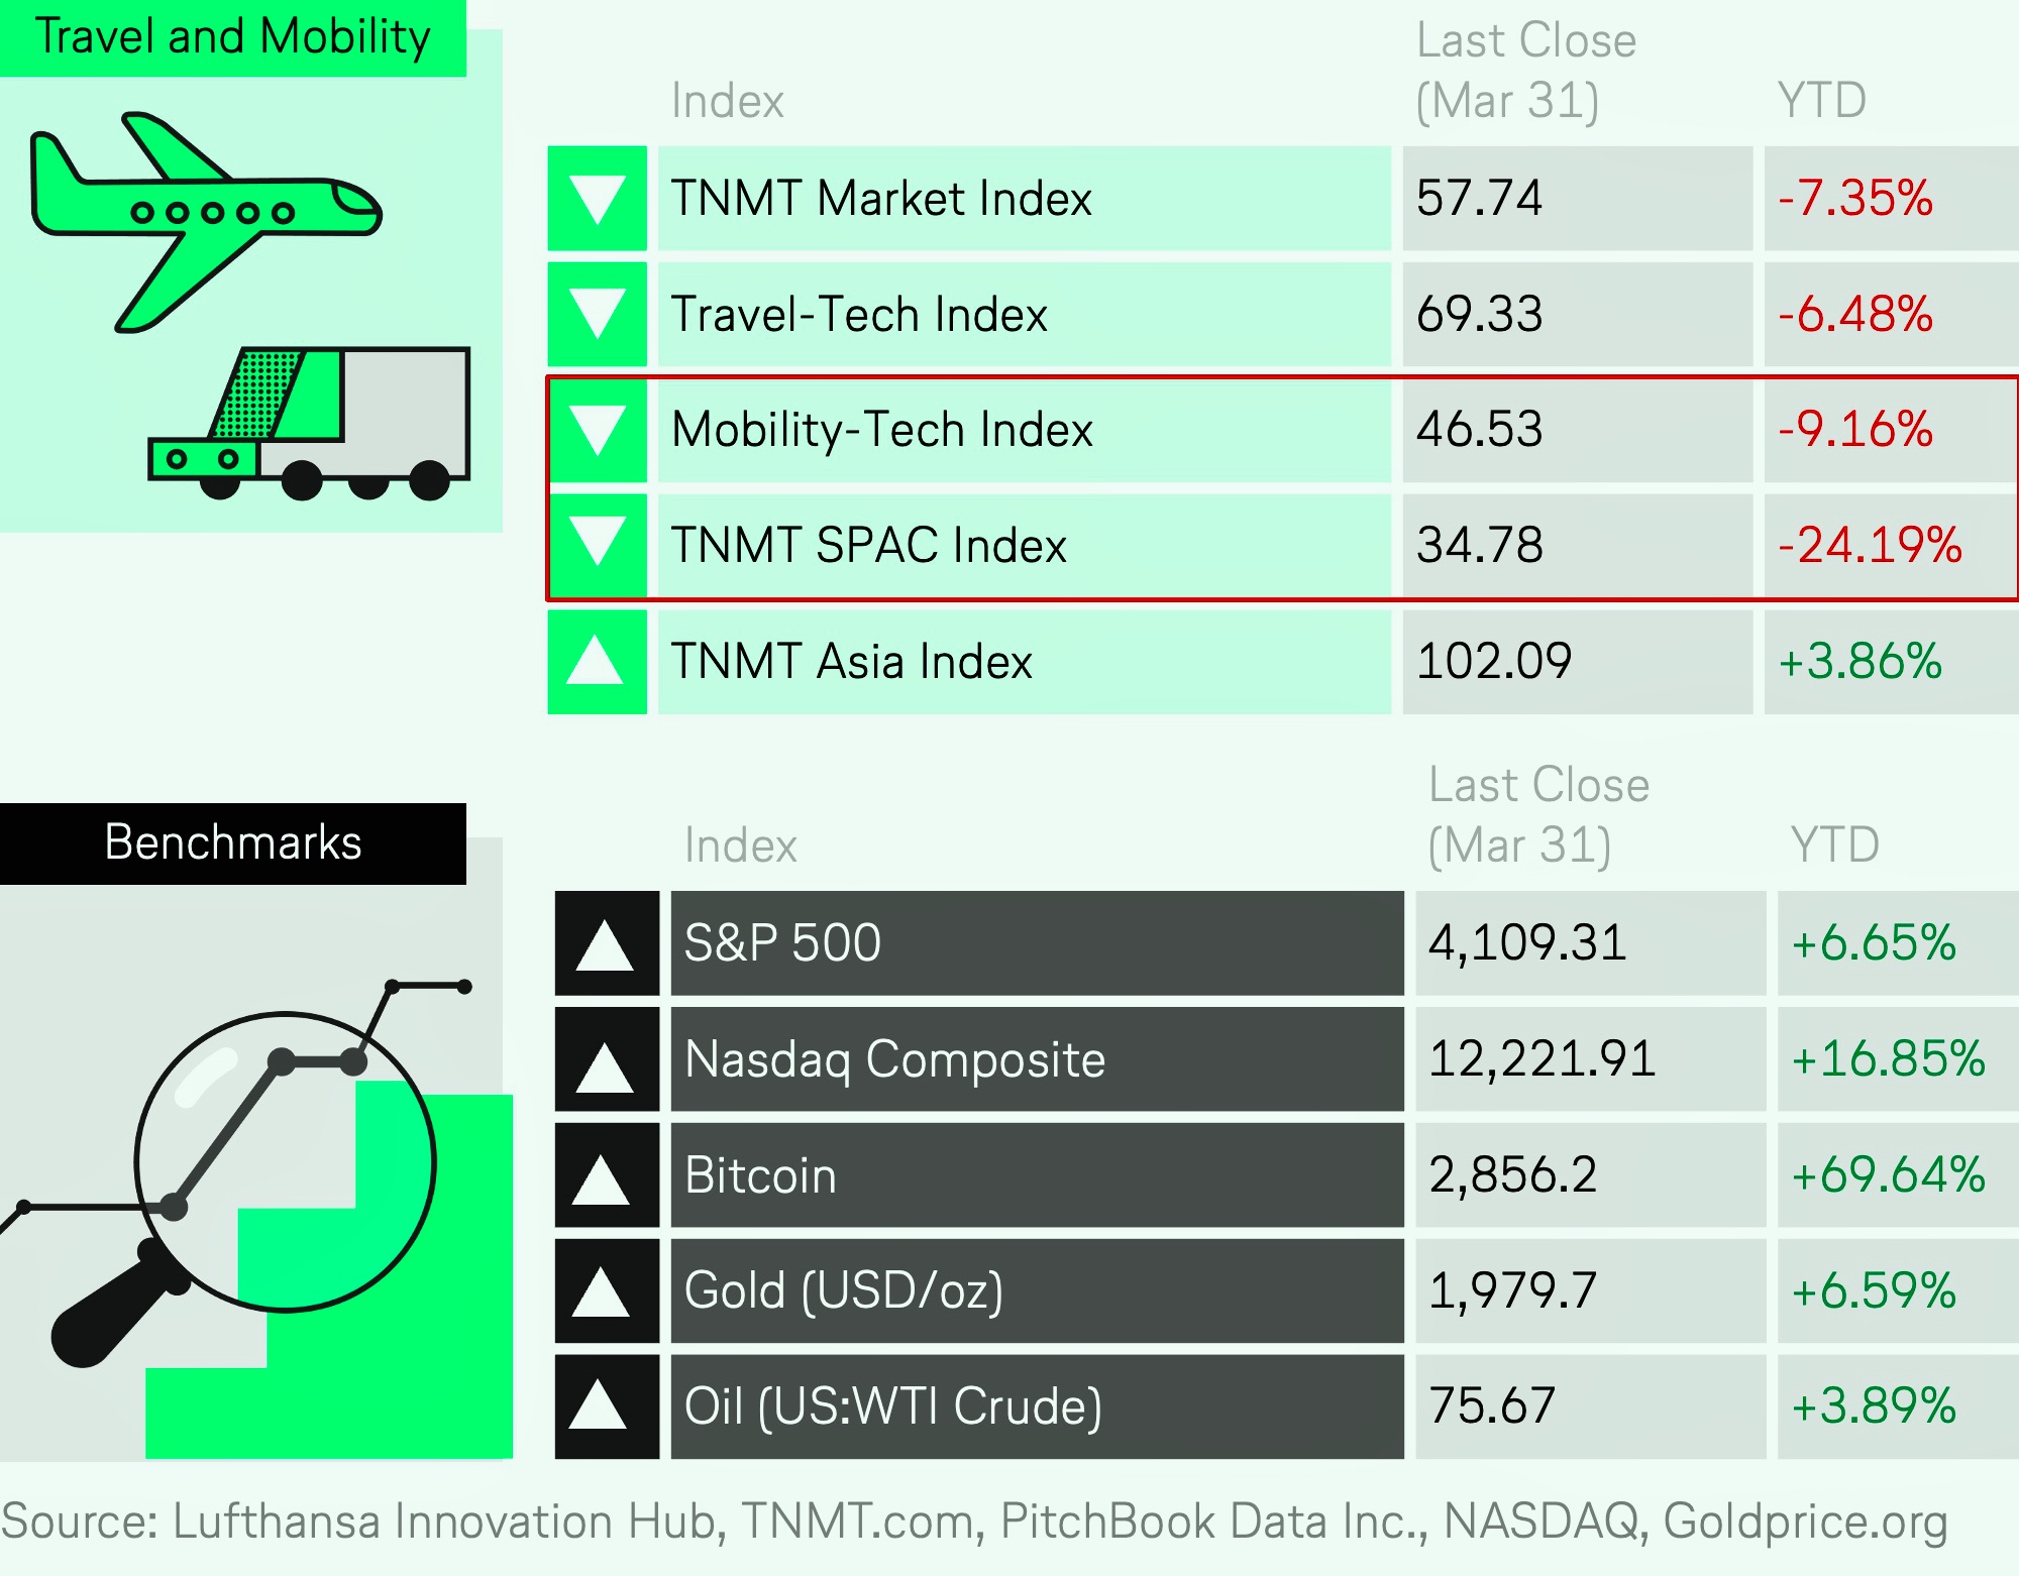
In a level of continuity from last year, the Mobility-Tech Index continues to have a tough life.
Wondering why exactly Mobility-Tech players are struggling more than their travel peers?
Check out our October commentary, where we discussed this phenomenon in more detail.
It’s important to recognize that this phenomenon is not unique to one specific mobility company, but transcends the entire mobility space.
Here, even comparatively successful companies like Uber are facing significant corrections in valuations.
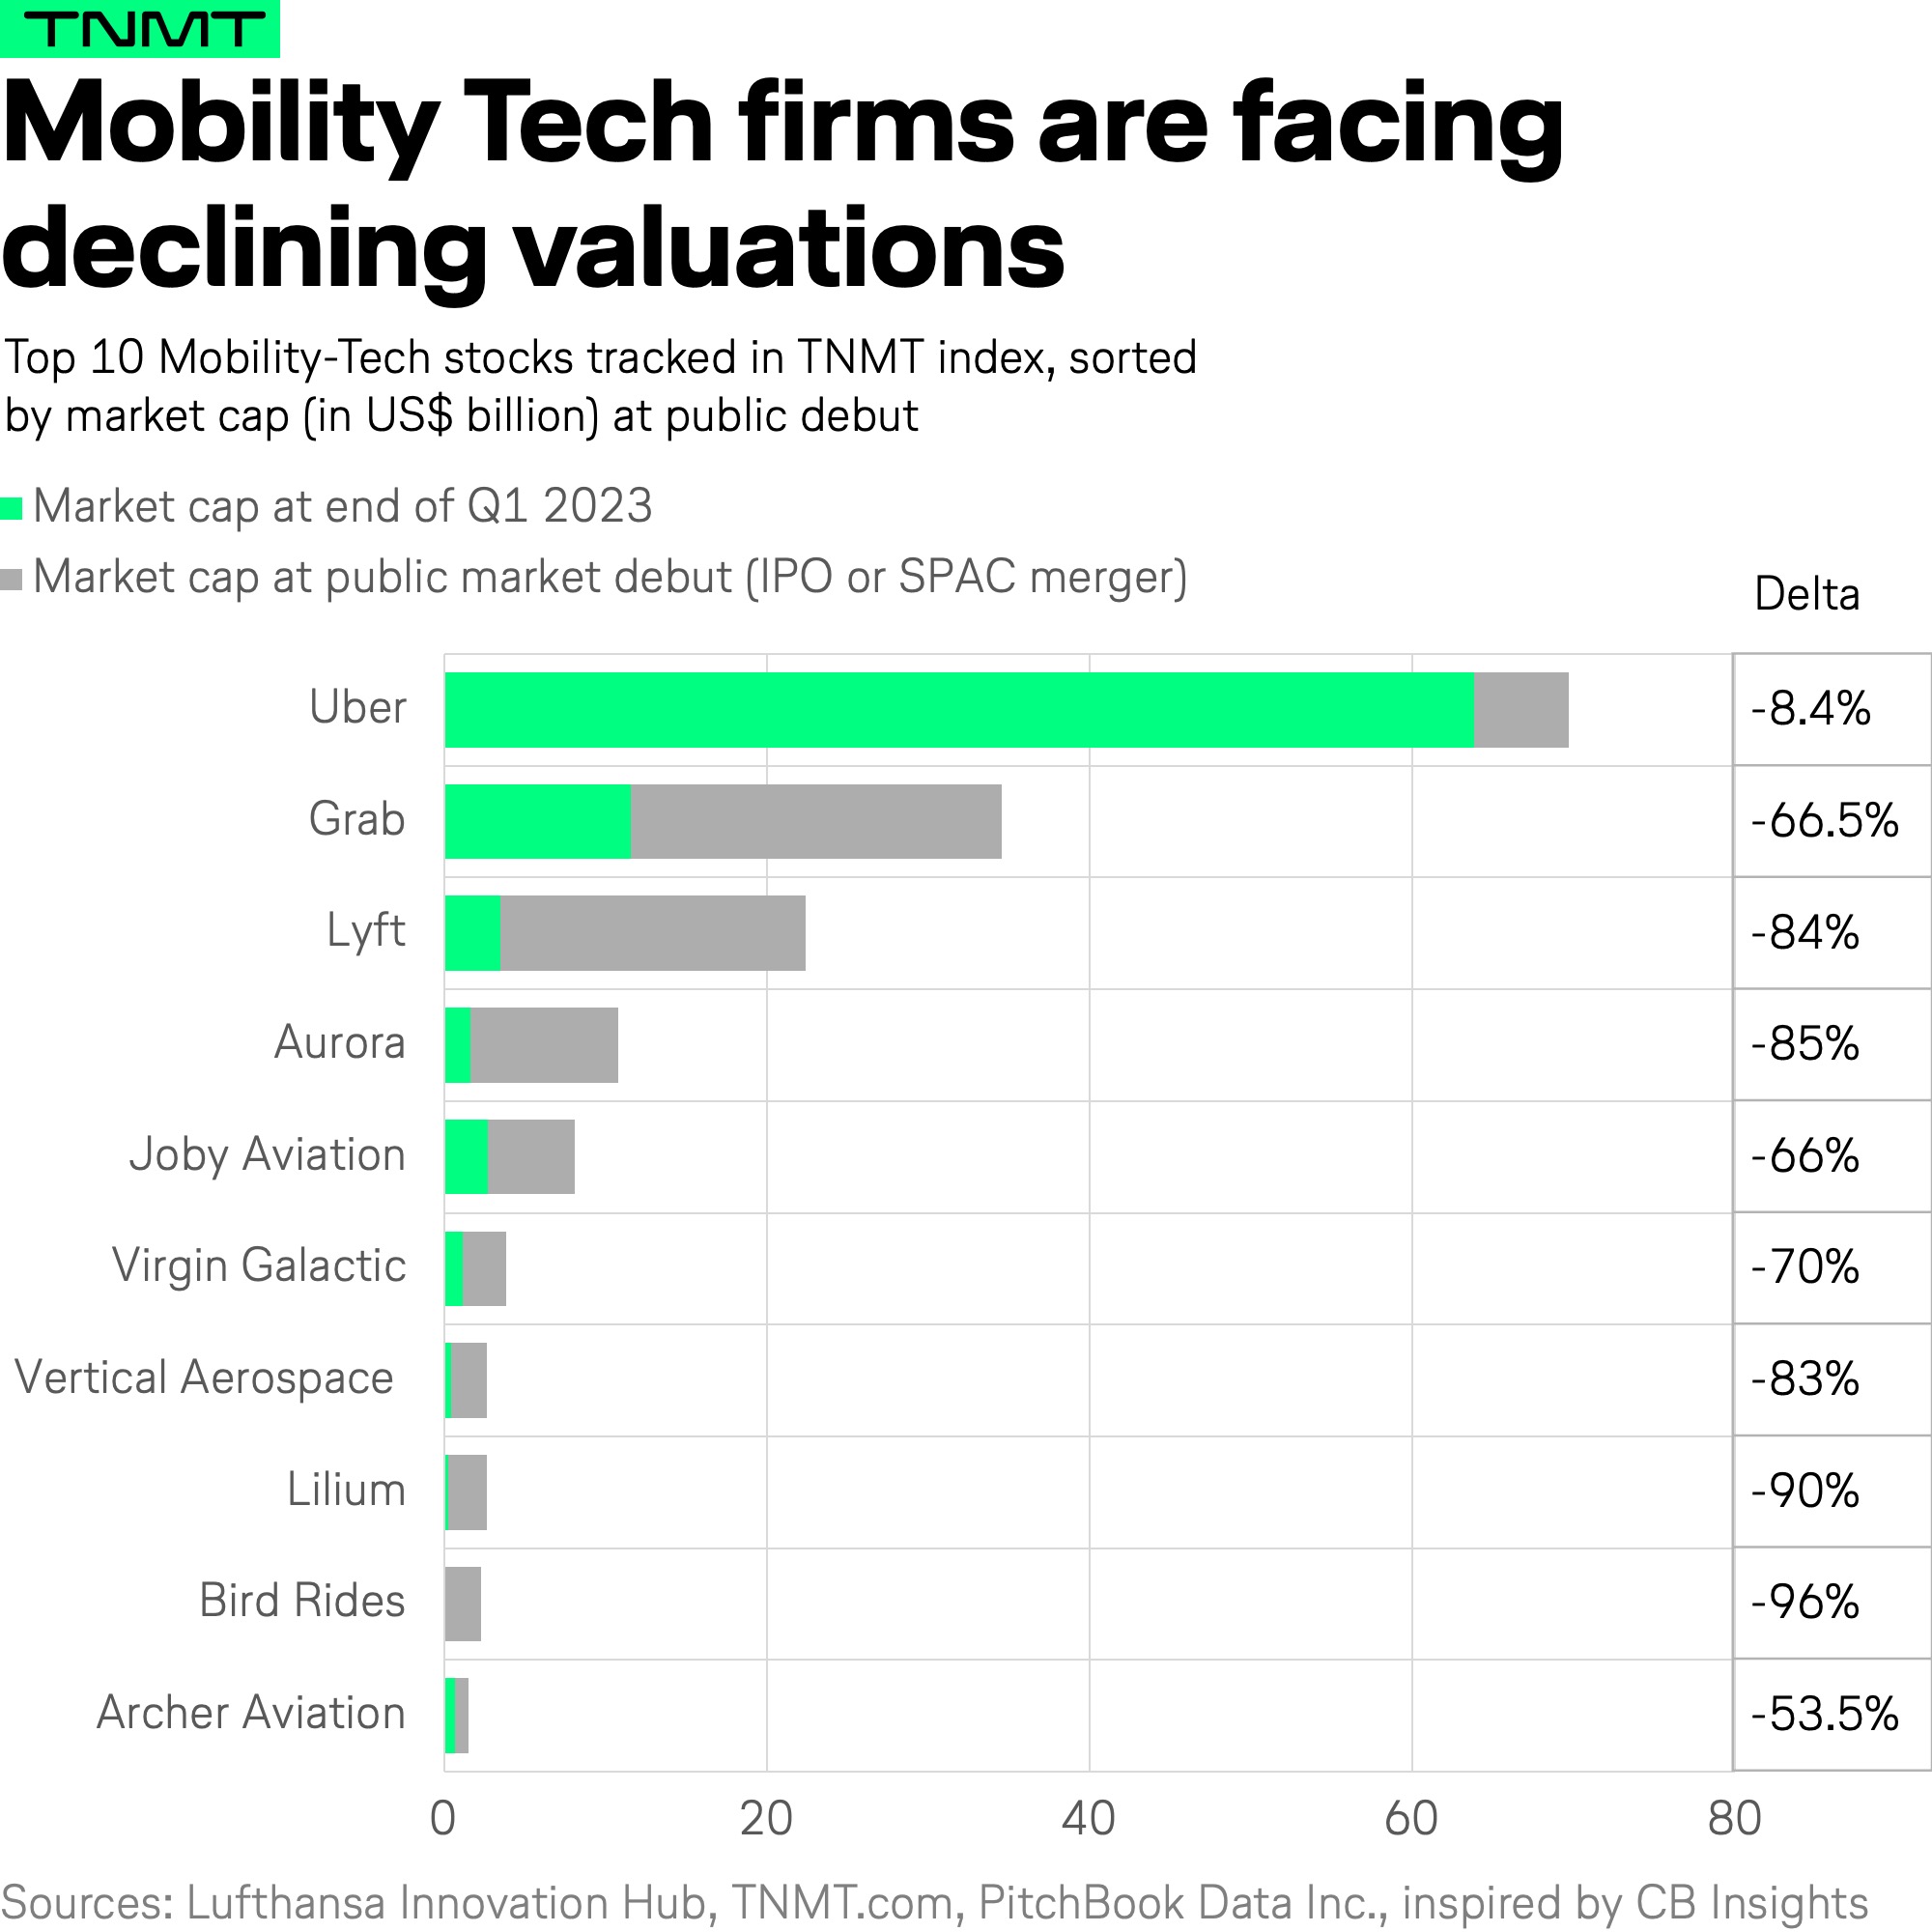
These declines span beyond the ten biggest companies in our index. Some other mobility examples of this include:
- US-based ride-sharing marketplace HyreCar, which we tracked in previous versions of this index, was delisted by the Nasdaq in February 2023 for trading below its market value requirements.
- Micromobility provider Helbiz announced a reverse stock split, alongside a name change to Micromobility.com, in late March 2023. A reverse split is a measure to consolidate the number of existing shares into a smaller number of higher-priced shares. And despite this admirable attempt to forgo a renewed delisting notice from NASDAQ, this action left the stock trading at -43% in the YTD comparison.
- In February 2023, UK-based car-sharing company Getaround announced it would lay off 10% of its staff. This comes at a time when Getaround has received several warnings from the NY Stock Exchange because its closing price and its market capitalization are too low.
- Egyptian shared mobility provider SVWL started the year on a rally following the announcement that it would conduct a strategic review but ultimately had to admit defeat. Not only did it back out of its planned acquisition of Volt Lines, a Turkish B2B mobility startup, like many of its mobility peers, it has received multiple delisting warnings from NASDAQ. This prompted the company to announce a reverse stock split in an effort to drive up its share price.
So, while the TNMT Mobility-Tech Index dragged down the overall TNMT category in Q1/2023, there were some positive drivers to note, as briefly mentioned above.
One of the key factors was the performance of Asian companies.
Let’s take a closer look.
Charting Asia’s impact on the TNMT market landscape
Over the past three months, many Asian Travel and Mobility Tech companies have seen strong growth. This can be attributed to the gradual reopening of borders in many countries as the pandemic situation has improved. With more people able to travel again, demand for these services has increased, leading to a boost in revenue and profits. Overall, this trend is expected to continue as vaccination rates rise and travel restrictions are lifted further, presenting a promising outlook for the industry as a whole.
This is not the first time the stocks of Asian companies have responded strongly to local changes in travel regulations. For instance:
- In our September 2022 commentary, we noted that Japanese OTA Adventure Inc. was one of the biggest winners, driven by the gradual reopening of its homeland to tourism.
- As well, in our end-of-year 2022 commentary, we noted that while the travel recovery on a global level was slowing down and share prices of European travel firms were down significantly YTD, Asian OTAs continued to rally. Among them were Indian OTAs EaseMyTrip and Yatra, both leading our YTD performance table with stock prices that were up 78% and 48%, respectively. Furthermore, Japanese OTA Adventure was up +45% in 2022, and China’s OTA Trip.com showed a distinct uptick of 16.8%, which was likely driven by the anticipated easing of COVID restrictions.
The latter turned out to be the case. China’s border openings have been a major theme in 2023 thus far. The country gradually reopened its borders in January 2023, later announcing that it would officially let go of remaining travel restrictions.
This has and will continue to have a major impact on the inbound and outbound tourism flows in the region. According to a recent article from The New York Times, searches on Expedia.com from the US to China jumped by close to 40% following the government’s announcement in March.
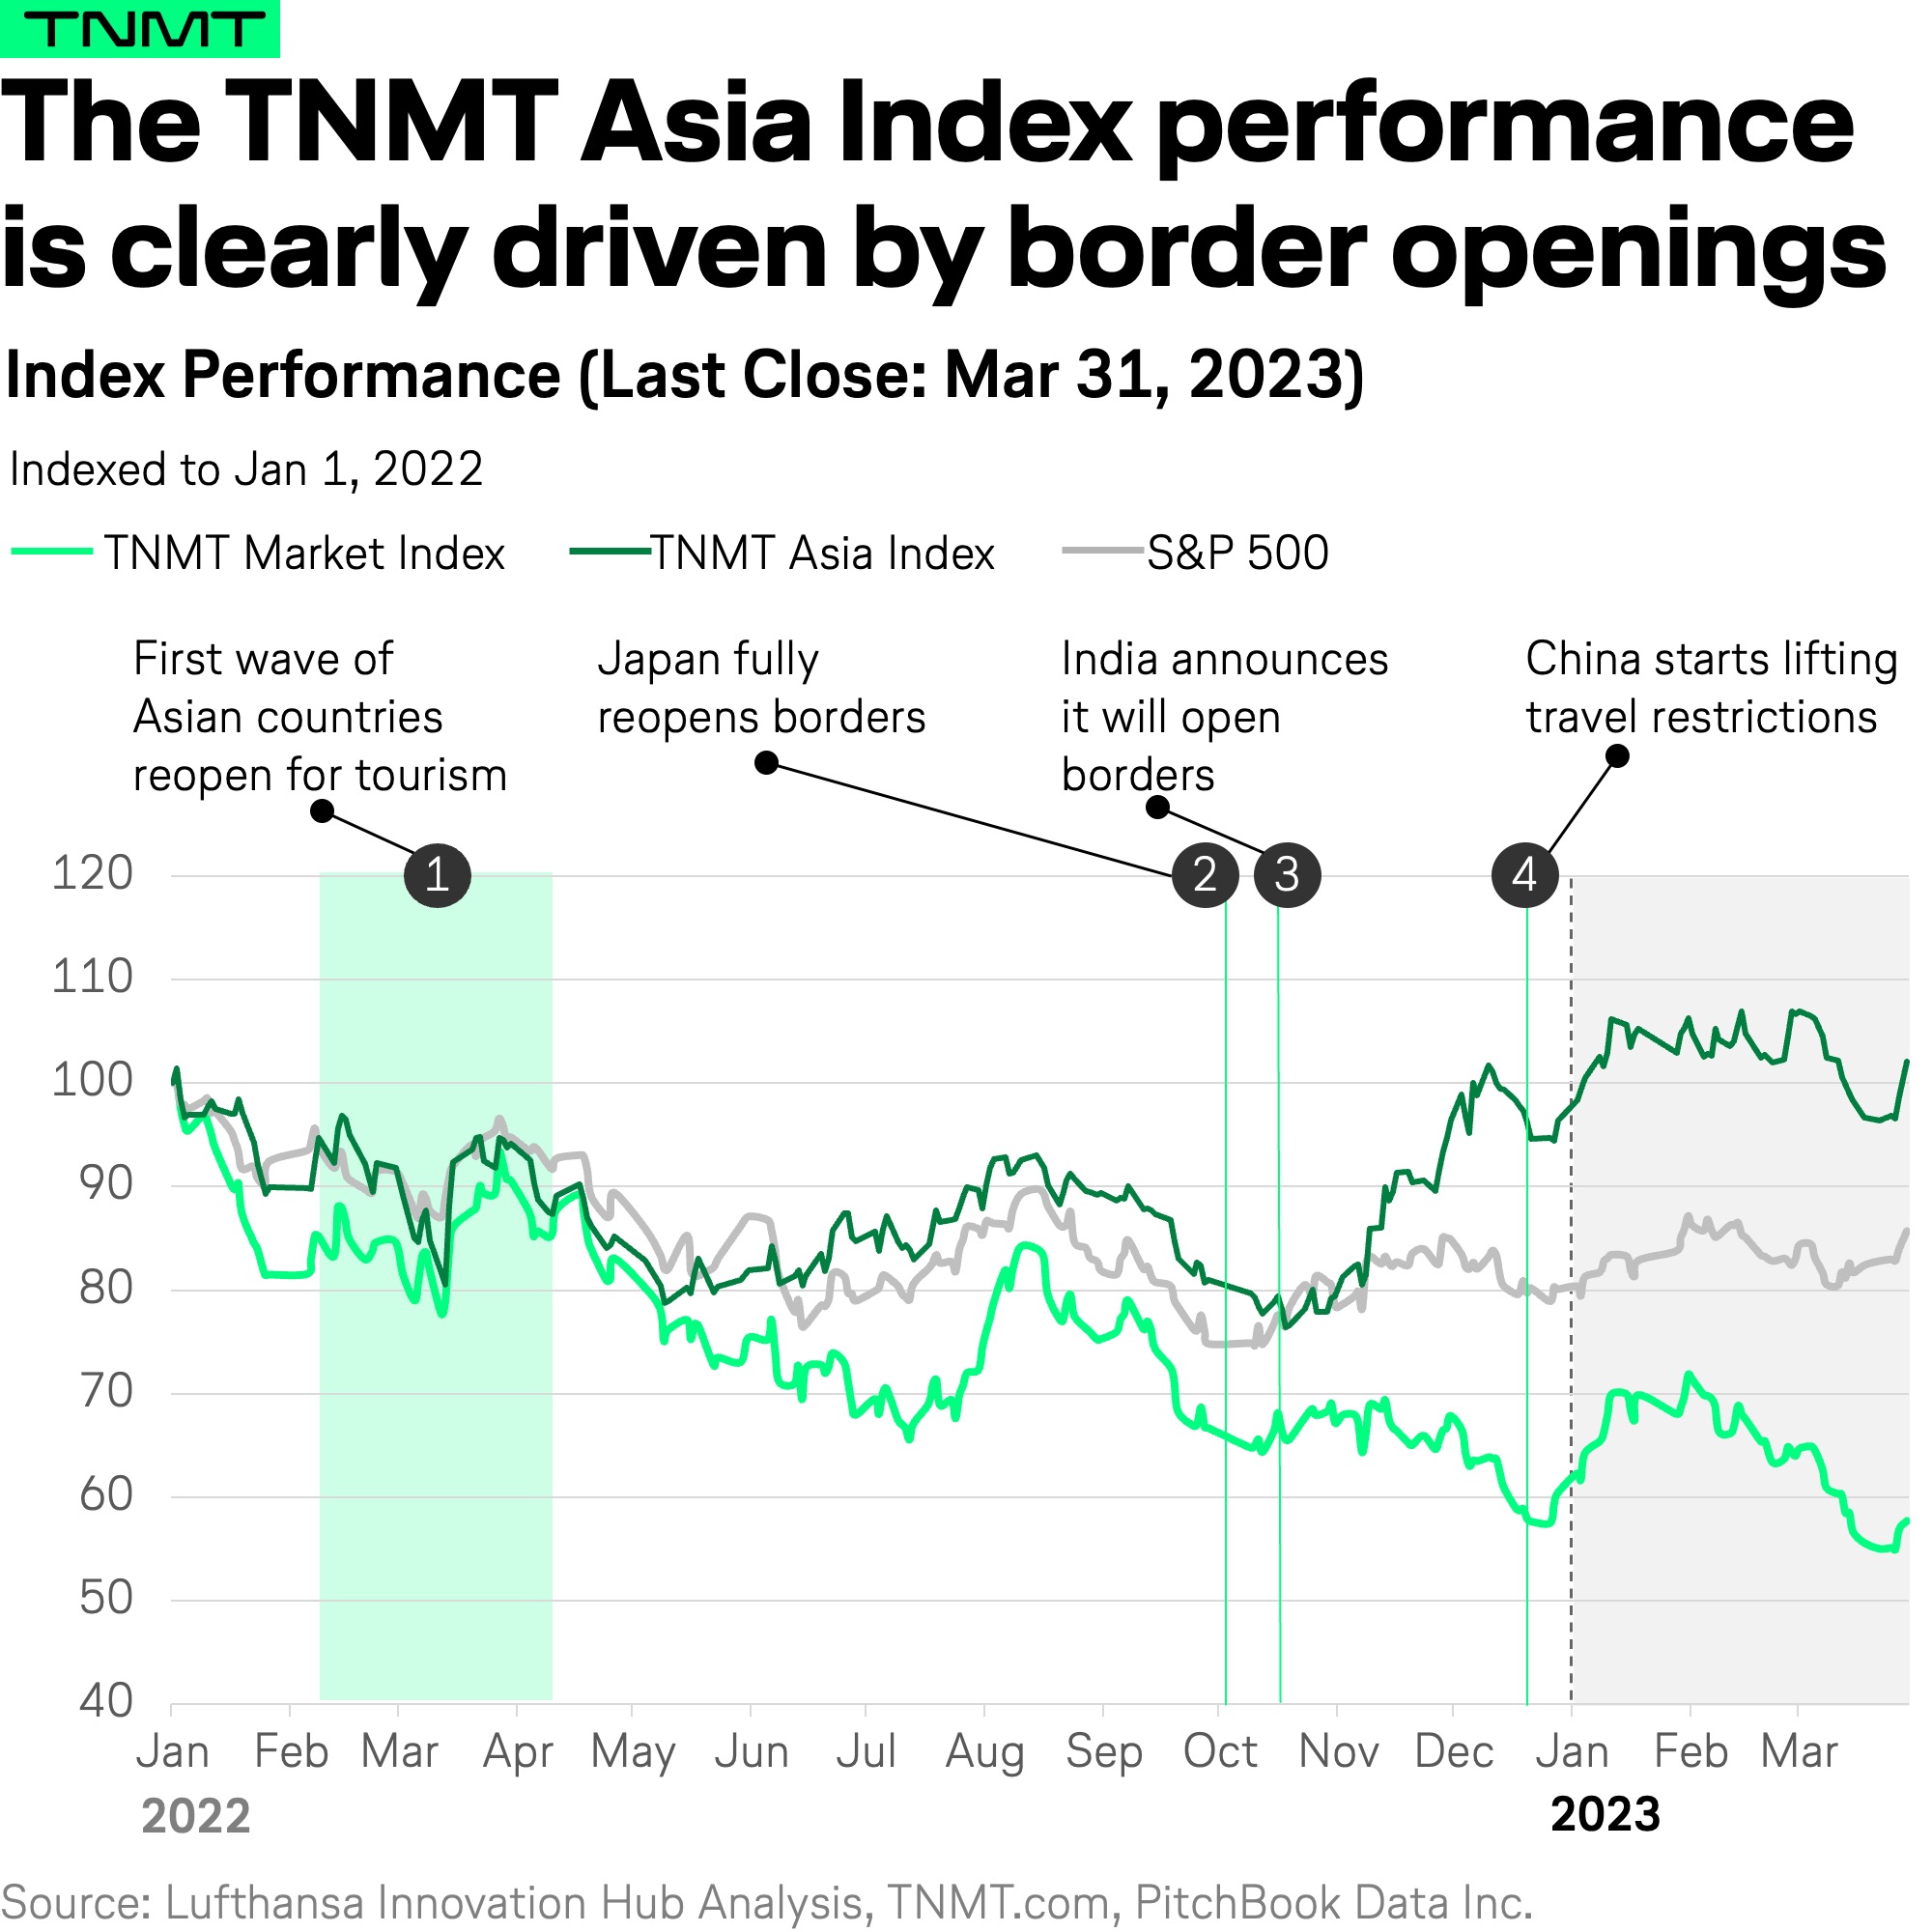
What’s remarkable when looking at the TNMT Asia Index trajectory (see chart below) is that rises in index value align closely with border reopenings across various countries, especially for mega economies like China and India.
- For example, we see a strong uptick in mid-November after India opened its borders to fully vaccinated foreign tourists, who were allowed to apply for visas from mid-October 2022. To be exact, our TNMT Asia Index jumped more than 20% in this timeframe, from approximately 78 points on October 31, 2022, to 93 points on Nov 30, 2022.
- Then, in early December, China started relaxing its zero-COVID policy, followed by an easing of travel restrictions later that month. And again, we see our TNMT Asia Index take a leap of almost 13% from approximately 95 points on December 28, 2022, to 107 in mid-January 2023.
With all this being said, the positive performance of Asian stocks is not the only influencing factor in this uptick of the overall TNMT Index earlier this year.
Strong 2022 financial results create momentum among travel stocks
Aside from the Asian TNMT Index rally, other factors impacted the positive momentum of our TNMT index earlier this year. What we shouldn’t forget is that 2022 was a big year for travel. Despite Russia’s war in Ukraine, the macroeconomic uncertainty, inflation, and related fears of recession, alongside a slowdown in travel demand after Q2/2022, the year brought with it a number of positive changes in regards to travel. After all, it was the year that countries across the globe finally lifted travel restrictions after two hard years of pandemic lockdowns.
Consequently, it was a good year for players in the travel industry, which was visible in companies’ annual results too.
As a result, a number of players could capitalize on the travel rush, among them Airbnb and Spanish OTA eDreams ODIGEO, both of which stick out in our YTD Company Table because of their positive performances in 2023, specifically:
- After a record 2022, Airbnb stock is up +40% YTD, driven by the company’s 2022 annual results; the short-term rental platform reported revenues of $8.4 billion USD, up 40% YOY, making it the first profitable year on a GAAP basis.
- OTA eDreams ODIGEO saw a +39% YTD increase. The Spanish OTA starts its fiscal year in March, which means its December results are related to the nine months between March 2022 and December 2022. Nonetheless, in its December results, the company reported a 59% increase in its revenue margin YOY, bringing it to over €419.5 million (approximately $458 million USD at the current exchange rate). During the same period, bookings also grew considerably by 35% YOY.
Airbnb continues to capitalize off of Blurred Travel
Airbnb, alongside other alternative accommodation stocks like HomeToGo, Vacasa, and Sonder, displayed positive momentum in January and February of 2023. And this advent was for good reason: 2022 was a big year for alternative accommodation in Europe and the US. According to AirDNA, a data and analytics provider for the short-term rental industry, European short-term rentals reeled in $55 billion USD in revenues, up 39% from 2021. US-based short-term rentals earned over $62 billion USD in revenues, a 25% YOY increase. This had investors start the year with high expectations for startups’ year-end results.
For Airbnb, this upward movement is related specifically to its Q3/2022 results, in which the startup reported that revenues were up 29% YOY. As well, nights and experiences booked had increased by 25% YOY. Importantly, during the conference call, one of the points emphasized was that long-term stays made up a significant percentage of bookings; specifically, 20% of bookings extended beyond 30 nights. This shows how short-term rental companies continue to leverage the Blurred Travel trend.
In the words of Brian Chesky, Airbnb CEO, from the startup’s Q3 Earnings Call:
“Now, with regard to long-term stays beyond travel, I mean feedback, I would just say that we have only scratched the surface. A fifth of our nights booked are for stays longer than a month. And this is before making some really big fundamental improvements to this product in this category. And I think in the coming years, flexibility is here to stay. I think more people are going to work remotely in a hybrid way 5 years from now than they do today.“
Since the initial spike in January 2022, Airbnb has managed to keep up the momentum. The company has topped up these positive quarterly results with equally positive end-year results for FY2022. Consequently, Airbnb’s stock jumped by more than 15% in a matter of days—between February 14, 2023, the day of the earnings call, and Feb 16, 2023, the latest high of Airbnb’s stock, the stock price went up by more than $20 USD.
Next to Airbnb, HomeToGo has also managed to convince investors with a sizeable 32% increase in booking revenues compared to 2021, therefore, trending at +9% YTD at the end of Q1/2023.
However, not all alternative accommodation stocks managed to live up to investors’ expectations; see the chart below.
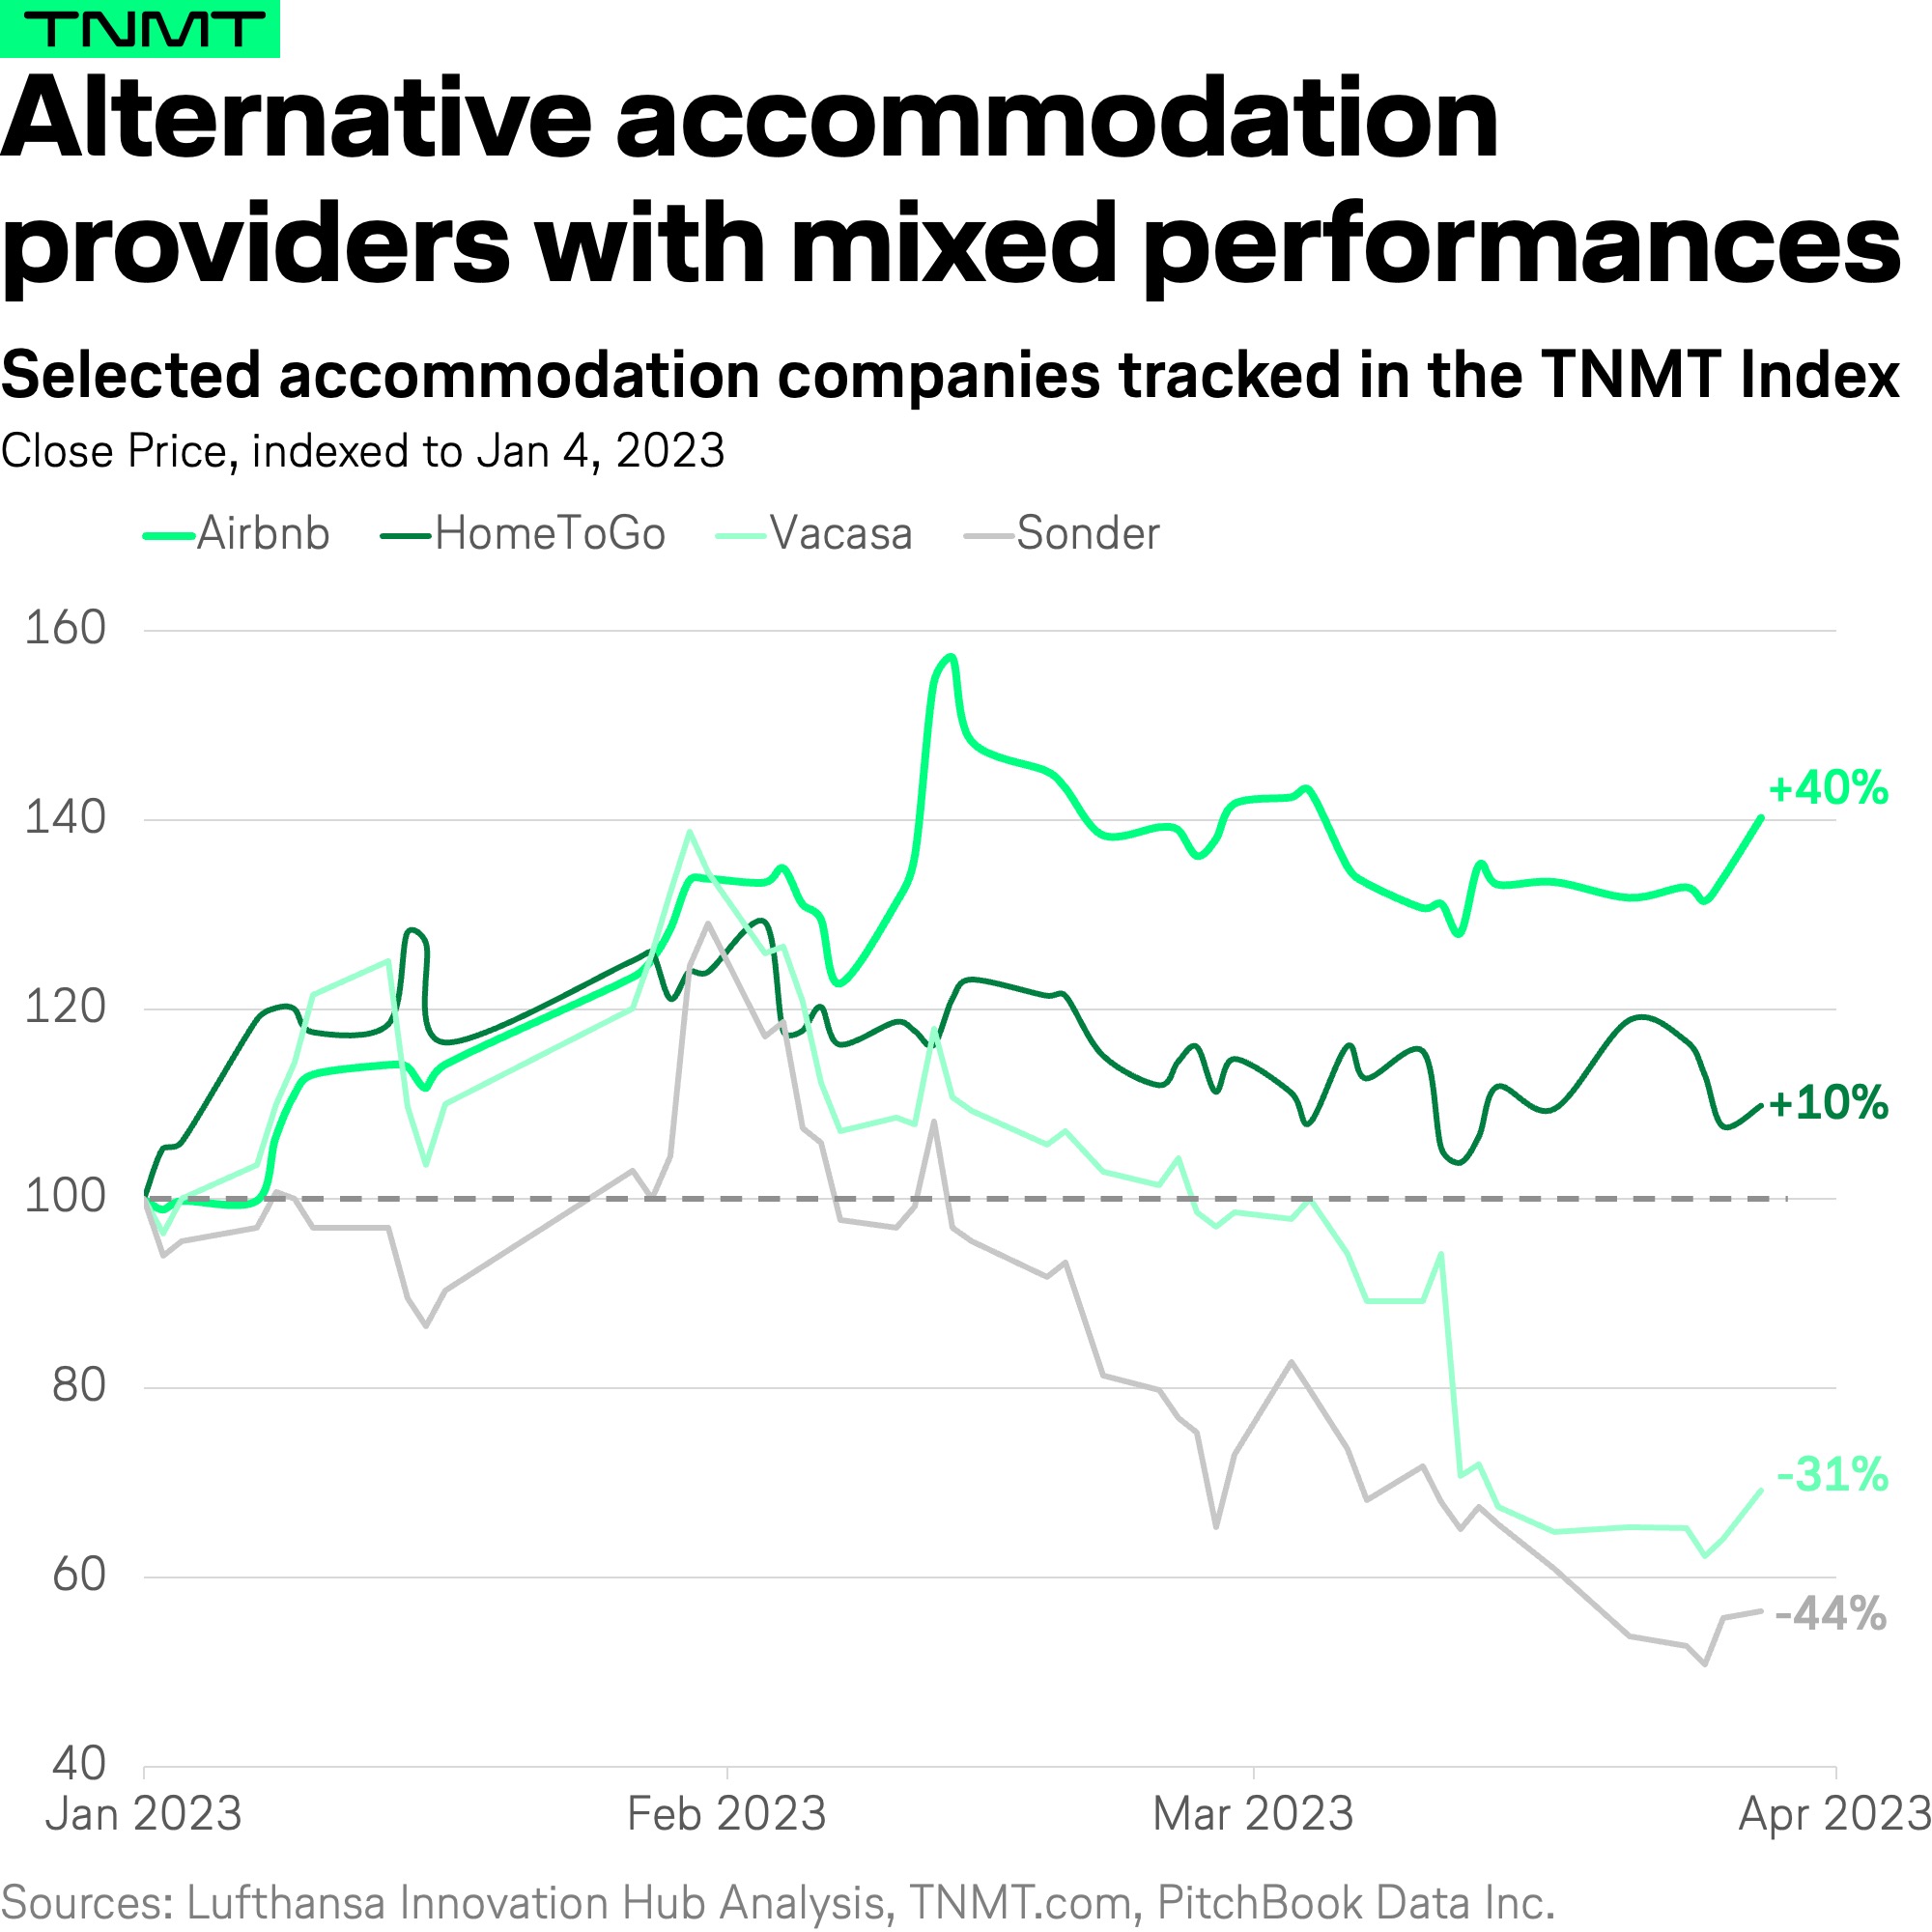
For instance, Vacasa and Sonder are down -30.8% and -43.5%, respectively, in 2023. And not without reason:
- In late January, Vacasa announced that it would lay off another 1,300 employees, approximately 17% of its workforce. Moreover, the company reported elevated levels of homeowner churn that resulted in a downward adjustment of estimated revenues as part of its Q4/2022 report.
- Similarly, Sonder is facing its second round of layoffs since going public. Specifically, in early March, an SEC filing indicated it would lay off approximately 14% of its workforce in an effort to become cash flow positive by year’s end.
eDreams’ pivot to loyalty has reaped rewards
In the OTA category, one company heads the 2023 YTD leaderboard: eDreams ODIGEO.
The Spanish OTA and parent company to a number of European travel brands, including Opodo and Go Voyages, started testing its subscription service Prime as early as 2019. Against an annual fee, this subscription lets users book flights, hotels, and car rentals at a discount only available to Prime members.
Fast forward to 2023: According to its February 2023 earnings call, eDreams’ subscription service had 3.9 million members by year’s end of 2022, which represents an 81% increase versus the same period the year before. And aside from delivering a successful loyalty program, this has impacted the company’s fiscal results too. Stressed in its earnings call was the fact that prime memberships significantly impact margins by:
- Delivering recurring revenues, and
- Delivering increasing revenues as the maturity of members improves. This is because customer acquisition costs are significantly lowered when customers renew their subscriptions.
When taken together, all of these factors have contributed to the company’s cash revenue margin exceeding pre-COVID levels by 10%. Specifically, the company reported €419.5 million (approximately $458 million USD at the current exchange rate) in cash marginal profit for the nine months between March 2022 and December 2022, 56% of which was delivered through bookings by prime members, up 61% from the same period the year before.
Final words: What’s next?
In summary, looking back at the performance of the TNMT Market Index in Q1/2023, it’s clear that some categories in the Travel and Mobility Tech industry have been major drivers of its early outperformance against the broader market. In particular, the industry benefited from strong growth in Asian Travel and Mobility Tech companies during the first two months of the year, while Mobility stocks saw another major decline in March 2023.
As we move forward, it’s difficult to predict which forces will have a stronger impact on the TNMT Market Index going forward.
However, it’s clear that the overall economic outlook, including the inflation and interest rate outlook, will continue to have a significant impact on the industry’s performance.
As such, investors and industry professionals will need to stay informed and adapt their strategies accordingly in order to navigate this evolving landscape.
Stay tuned for future updates on the TNMT Market Index.