The COVID-19 pandemic is one of the most challenging tests the Travel and Mobility Tech sector has ever faced. While we have discussed its impact on the airline industry at length (see our pieces here or here and here), short-distance traveling (e.g. trains) as well as urban traveling (e.g. public transport) have been equally shattered as our Category Heatmap shows. In April 2020 alone, public transport plunged by more than 80% in New York City. Cities in France and the UK saw drops of about 90% in the same time period while many Asian countries saw their public transit system shut down entirely.
Despite these grim numbers, we have been seeing more positive signals in recent weeks across most markets. It turns out that the thirst to venture out again – initially within our neighborhoods, then across cities and, ultimately, to other regions and countries – seems to be a universal human desire.
However, the pace at which this pattern shows up varies by country, depending on how hard it has been hit by Covid-19 infections, the respective lockdown measures initiated by governments, and people’s overall sentiment.
So, we wanted to find out which countries might resume this kind of travel activity sooner than others.
Our findings could be an important indicator for international travel providers – from bus operators to ride hailers and airlines – to better understand which of their markets could reflate the soonest.
What did we do?
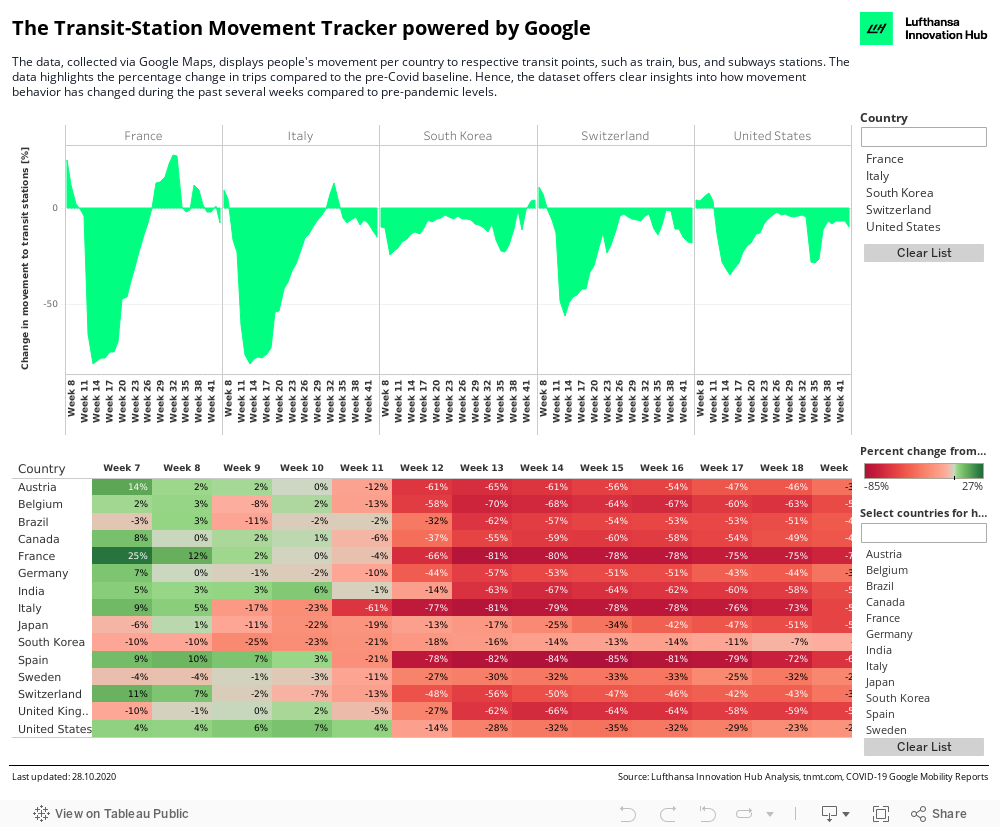
We utilized publicly available mobility data from Google, which enabled us to get insights into travel trends for millions of people.
We looked at the movement in each country’s respective transit points, such as train, bus, and subway stations. We find this category most interesting from a travel perspective because public transport hubs are the ultimate starting point for many trips that go beyond the borders of a city – thereby, representing an early proxy for travel demand that goes beyond “urban mobility.” Secondly, trips to transit stations and getting from A to B on a train or bus suggest that people are willing to spend time in closed metal tubes again – in our opinion, this is not too different from the experience of flying in a commercial plane.
The Google dataset documents its users’ movement through Google Maps. The data highlights the percentage change in trips compared to a baseline value for the specific day. The baseline is made up of a median value during the five-week period between Jan 3 – Feb 6, 2020, which represents the pre-Covid standard. Hence, the dataset offers clear insights into how movement behavior has changed during the past several weeks compared to pre-pandemic levels.
The mobility data we used in our analysis ranges from Feb 15 – June 7, 2020, which was the data available at the moment of this writing. However, Google updates its reports on a weekly basis. Read more about Google’s data documentation here.
Which countries did we compare?
To get a global perspective, we looked closely at 15 countries around the world that seem to be at different stages of their COVID-19 curves.
However, Google provides mobility data for over 130 countries, so we urge you to explore them through the Tableau dashboard view below our graphic. China is excluded as the Google data was not available for this country.
Here is the comparison for our 15 selected markets:
And here is the interactive version for 130+ countries in Tableau format:
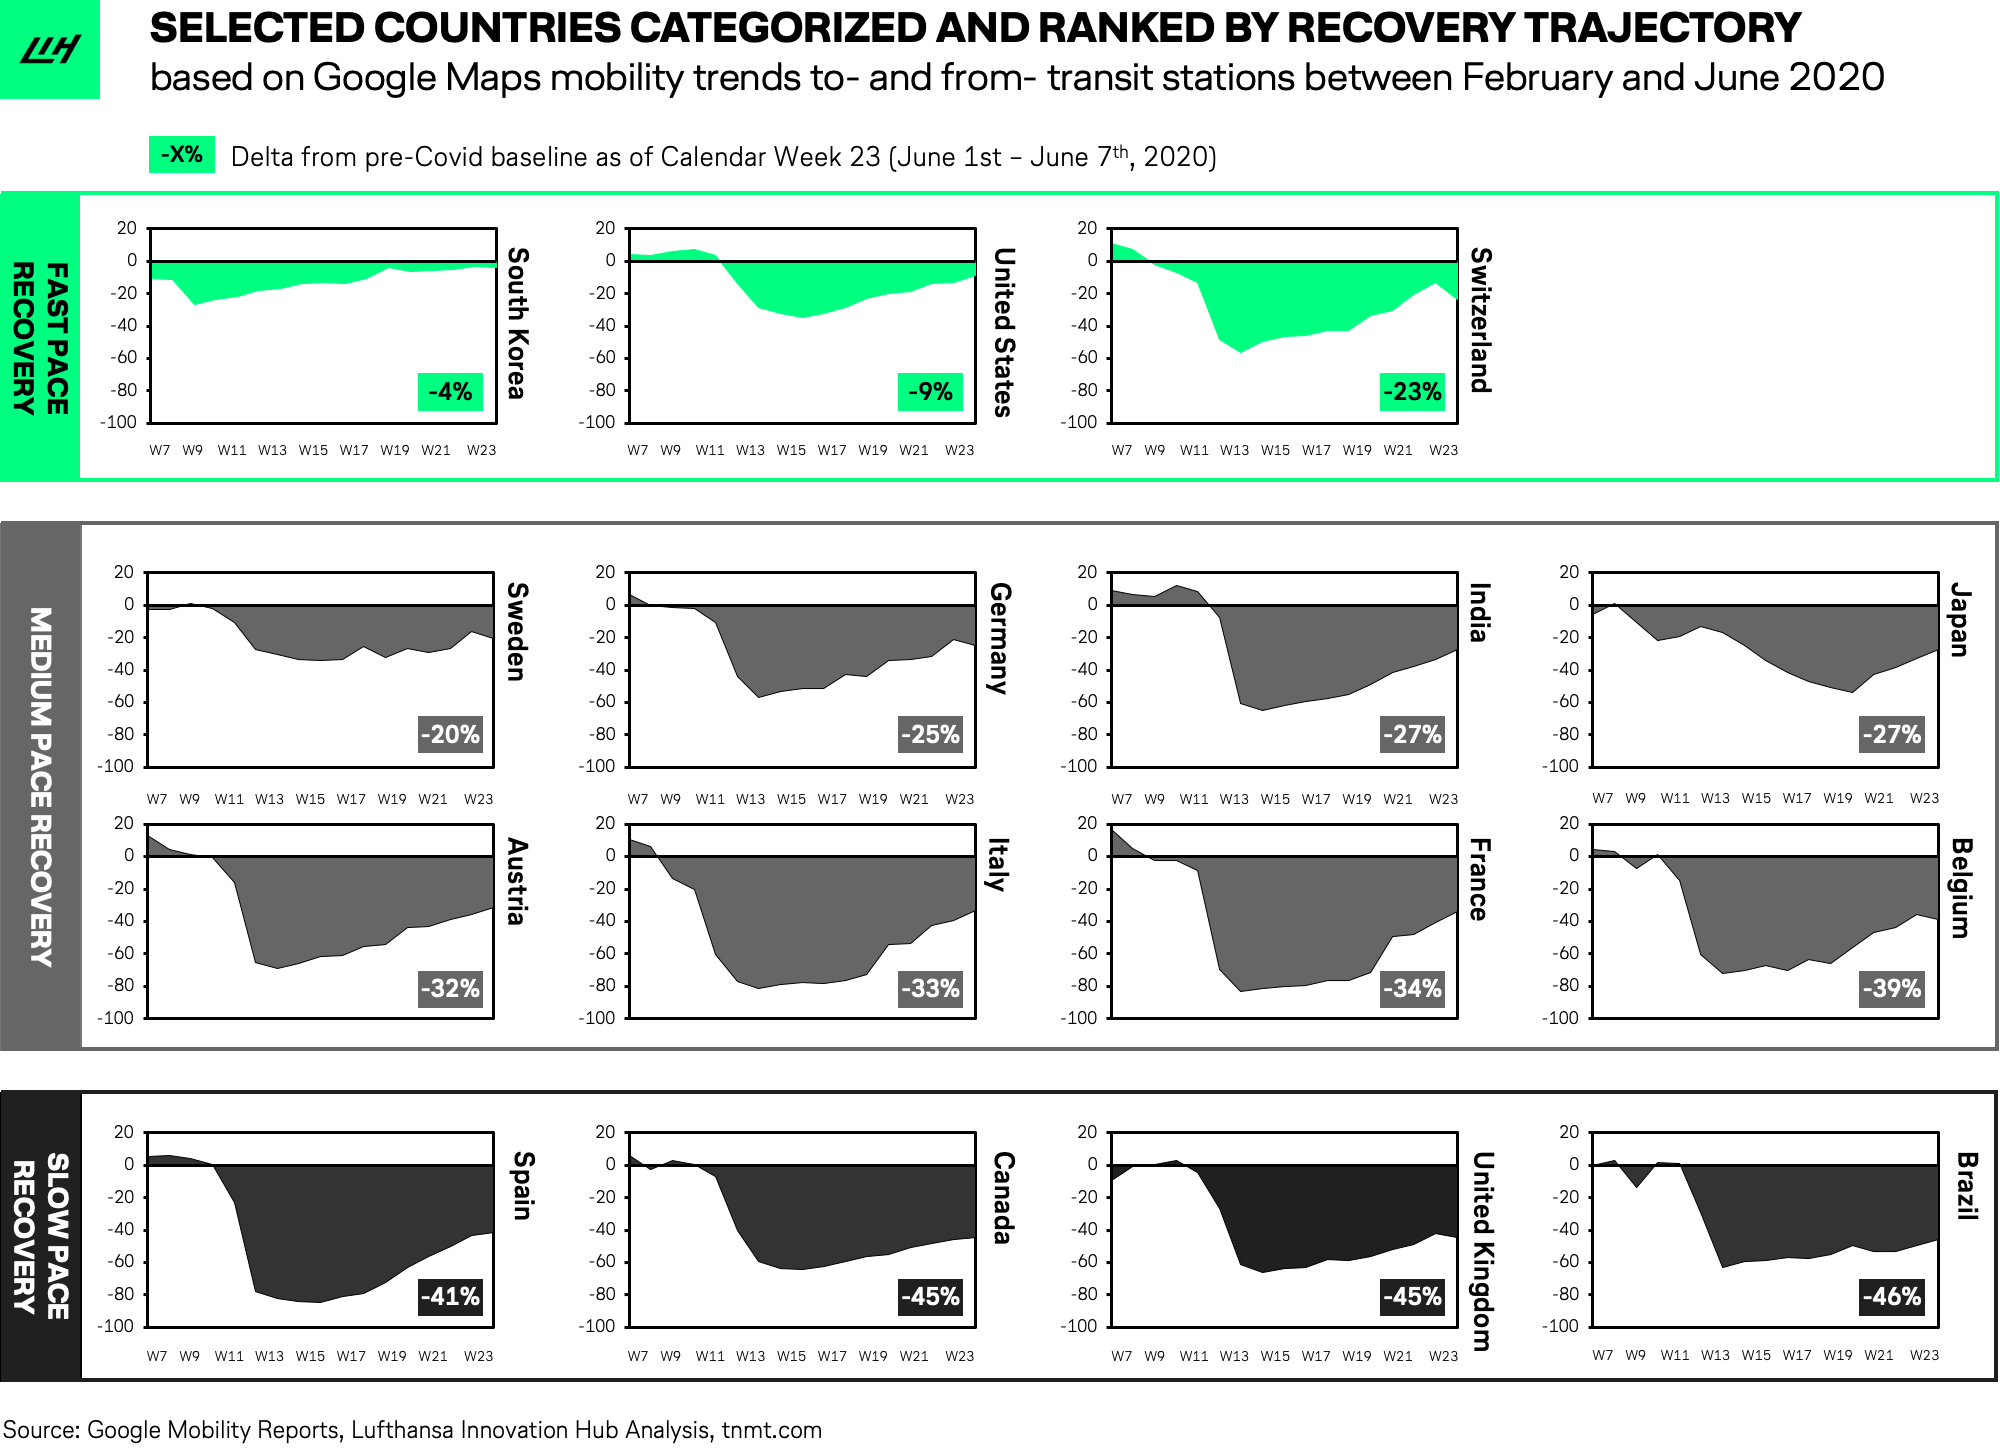
Based on the data charts, we clustered the 15 countries into three groups based on their transit-station mobility recovery trendline: fast vs. medium vs. slow.
The fast recovery group
Countries in the fast recovery track show a quick rebound, experiencing an average of 0 – 20% decline in movement to transit stations compared to the pre-Covid baseline.
Worth highlighting in this group is South Korea, which exhibits the fastest recovering market with the lowest change from the baseline. The country avoided a rather strict lockdown, and instead managed to contain spreading through its tech-powered contact tracing, as well as extensive testing. In early May, their transit station movement index had already recovered to only 4% below baseline. The particularly low delta in that week is driven by a national holiday (April 30 – May 5) that caused domestic travel demand and hotel bookings to surge.
Afterwards, the index decreased again to -6% levels but the overall trendline clearly implies that Korea is preparing for a full-blown restart in travel. As a matter of fact, the country is currently negotiating so-called ‘travel bubbles’ with other Asian countries that would enable free travel without self-quarantine requirements upon arrival. We think there is a high chance that we’ll see South Koreans taking international trips again soon.
The second major country with a rather limited drop in transition movements is the U.S., where most states had followed rather relaxed lockdown measures compared to most other countries – with some exceptions such as New York. This observation is in line with flight capacity trends that also remained relatively high in the U.S. compared to most other countries, mainly driven by relatively strong domestic flight capacity. Several American carriers are now reporting moderate improvements in travel demand and are planning to add more capacity for both domestic and international flights starting throughout June.
The third market in the fast-recovery group, and a bit of an exception, is Switzerland. The country did impose strict lockdown measures and consequently witnessed dramatic decreases in transit movement, in fact to much lower levels than Korea or the US (e.g. -80% delta in calendar week 13). However, people resumed transit mobility even before lockdown measures were lifted and movement behaviour escalated further as soon as restrictions were officially eased (change of 9 percentage points in CW19). Therefore, given the eagerness of the Swiss to travel again, we assume travel demand will recover in Switzerland faster than in other medium-track countries.
The medium recovery track
The medium recovery track comprises countries where movement trends in transit stations are still far below pre-crisis levels (to an average -20 to -40% delta) but on an upward trajectory.
Most countries in our sample fall into this medium recovery track — for instance, Germany, India, and Austria as well as heavily hit Italy and France. What these markets have in common is that transit mobility spiked immediately after loosening lockdown measures, for instance in Germany by a jump of 10 percentage points, and mobility trends have been swiftly increasing since then. For all countries in this category, we expect mobility trends to continue to pick up in the coming weeks.
Sweden is an interesting outlier within the medium-paced-recovery group. The country has witnessed an overall lower drop in transit mobility, which is comparable to the fast-paced recovery countries. How come? Sweden has distinguished itself by adopting a strategy to ‘develop herd immunity’ instead of strict social distancing. Therefore, it is no surprise to see a smaller negative effect on public transit usage because people continued going to work, eating out in restaurants, and going shopping without major restrictions. However, Sweden’s chosen path can now be seriously questioned as a growing number of infections in recent days seem to limit the country’s transit mobility recovery.
The slow recovery group
The slow recovery track represents countries where the virus has resulted in high death tolls, a heavy impact on the economy, and people showing a very slow willingness to venture out again. In these countries (e.g. UK, Spain, and Brazil) movement trends plummeted to an almost standstill (up to a -80% delta) and tend to remain at very low levels (-40 to -50% vs. baseline) with only limited recovery potential as of now.
However, even in these most dramatically affected countries (except for Brazil), we see a visible upward trajectory suggesting a recovery. In Spain, the transit index jumped by around 10 ppts after lockdown measures were eased. This strong uptake could be because these countries had one of the longest lockdowns of all and people were even more eager to venture outside again. However, given the low absolute levels, we expect a very cautious and slow recovery for these markets — taking many more weeks, if not months.
What travel providers should take away
All in all, the vast majority of countries are on a recovery path. People are generally eager to spend time outside and travel again after many weeks of imposed quarantines and social distancing. Even for countries with very heavy outbreaks, movement patterns at transit stations suggest that travel is returning. We expect to see growing interest in domestic travel and weekend trips across most markets in the upcoming weeks, eventually culminating in international travel as early as this July, particularly for markets on the fast recovery track. Travel providers should closely observe these markets and expand their view towards the medium recovery group as we expect domestic and international travel to return sooner rather than later.