As you may recall from one of our May TNMT newsletters, we recently launched the TNMT Market Index.
The TNMT Market Index tracks the performance of leading startups-turned-public-companies in the Travel and Mobility Tech arena.
The index includes Airbnb, Uber, HomeToGo, Joby Aviation, Sonder, Vacasa, Virgin Galactic, and 33 more promising companies that aim to disrupt today’s travel incumbents.
What’s the rationale behind the TNMT Market Index?
By tracking and analyzing a basket of 40 emerging tech companies on a regular basis, we gain valuable insights into the current sentiment and health of the top players in the Travel and Mobility Tech sector.
What has been garnered from the current TNMT market pulse check?
We took a closer look at the performance in 2022 thus far.
If you are short on time, here are a couple of major highlights.
2022 in a nutshell
Put simply, 2022 has been an active year for emerging Travel and Mobility Tech companies.
How vibrant?
Well, here is the overview and breakdown of the major index fluctuations.
Let’s run through the major index events.
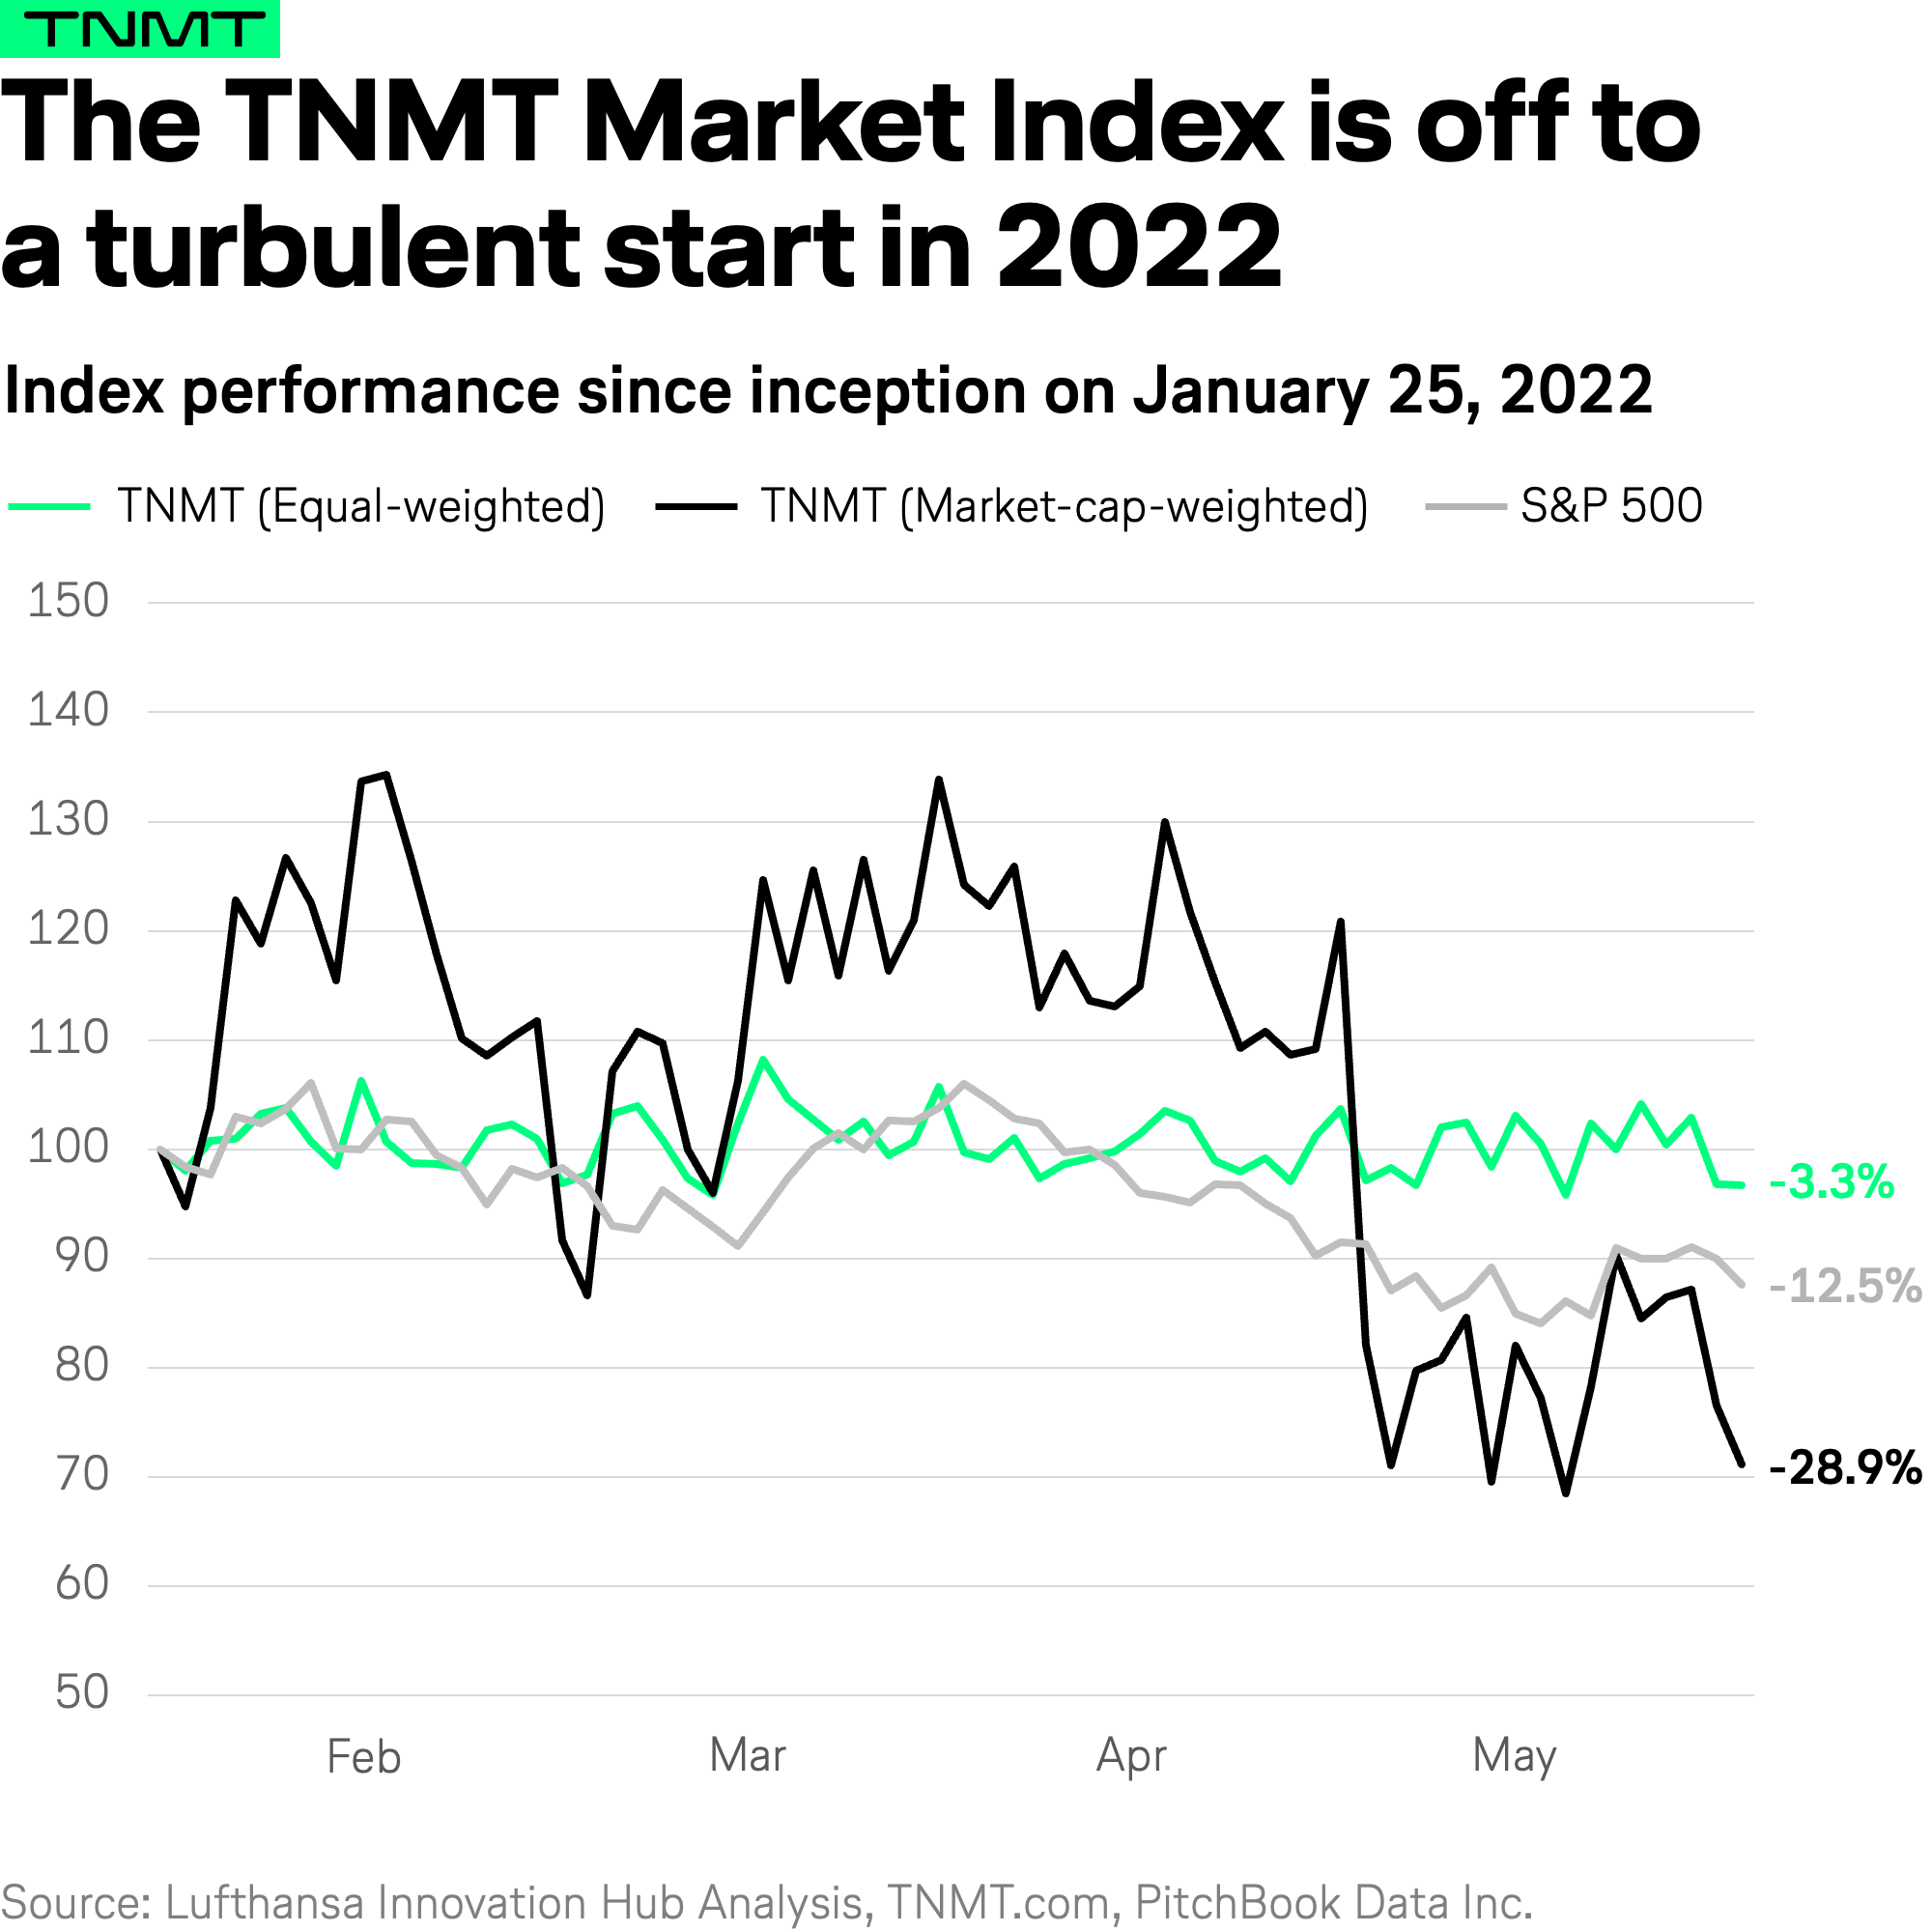
After an initial increase of the TNMT Index and two pinnacles in February, the Ukraine crisis took its toll and spurred global fears of another travel slowdown, which led to a spontaneous low in early March.
- This downturn is particularly visible in the market-cap-weighted TNMT Market Index. Here, the index dropped by 20% from its February highs in a matter of days.
- The equal-weighted TNMT Market Index, in comparison, remained relatively stable and dropped by a mere 4% only to recover again by 8% between March 7 and 8. This indicates that the broader travel and mobility industry was unlikely to be significantly impacted by the war, according to Mr. Market.
However, following a fairly stable late March and early April, a period marked by consecutive index highs, we have seen overall stock markets plunge once more, which also heavily affected the travel and mobility arena.
- In early May, the broader market, measured via the S&P 500, had registered five consecutive weekly declines—its longest losing streak since 2011, according to The New York Times.
- Unfortunately, this decline is replicated in TNMT stocks, too. Even worse, the TNMT Market Index outpaced the S&P 500’s downward trajectory, at least in its market-cap-weighted version. The index fell from 118 points to a stunning 68, which is a 50%+ decline, between April 28 and May 10. This drop was primarily driven by mega-companies like Uber and Airbnb. While almost all of the stocks in our index suffered a hit during this time, the market cap of these bigger companies pushed the index value to an extreme low—a characteristic we will explain in detail in the next section.
- In comparison, the equal-weighted TNMT Index displayed a remarkably stable trajectory and even outperformed the S&P 500 throughout its period of crisis—a positive phenomenon we will also explore below.
Overall, the first six months of 2022 have not been promising, both for the broader market and tech stocks, alongside our 40 Travel and Mobility Tech companies that make up the TNMT Market Index.
Therefore, the current pulse check of the Travel and Mobility Tech industry varies between an observant “neutral” or a slightly more positive “could be worse,” with decision-makers in the industry feeling nervous about how the second half of the year will unfold.
For our avid readers, however, hope is on the horizon.
After all, we are repeatedly seeing signs of recovery and our array of equal-weighted stocks maintained a significantly stable trend despite the market downturn.
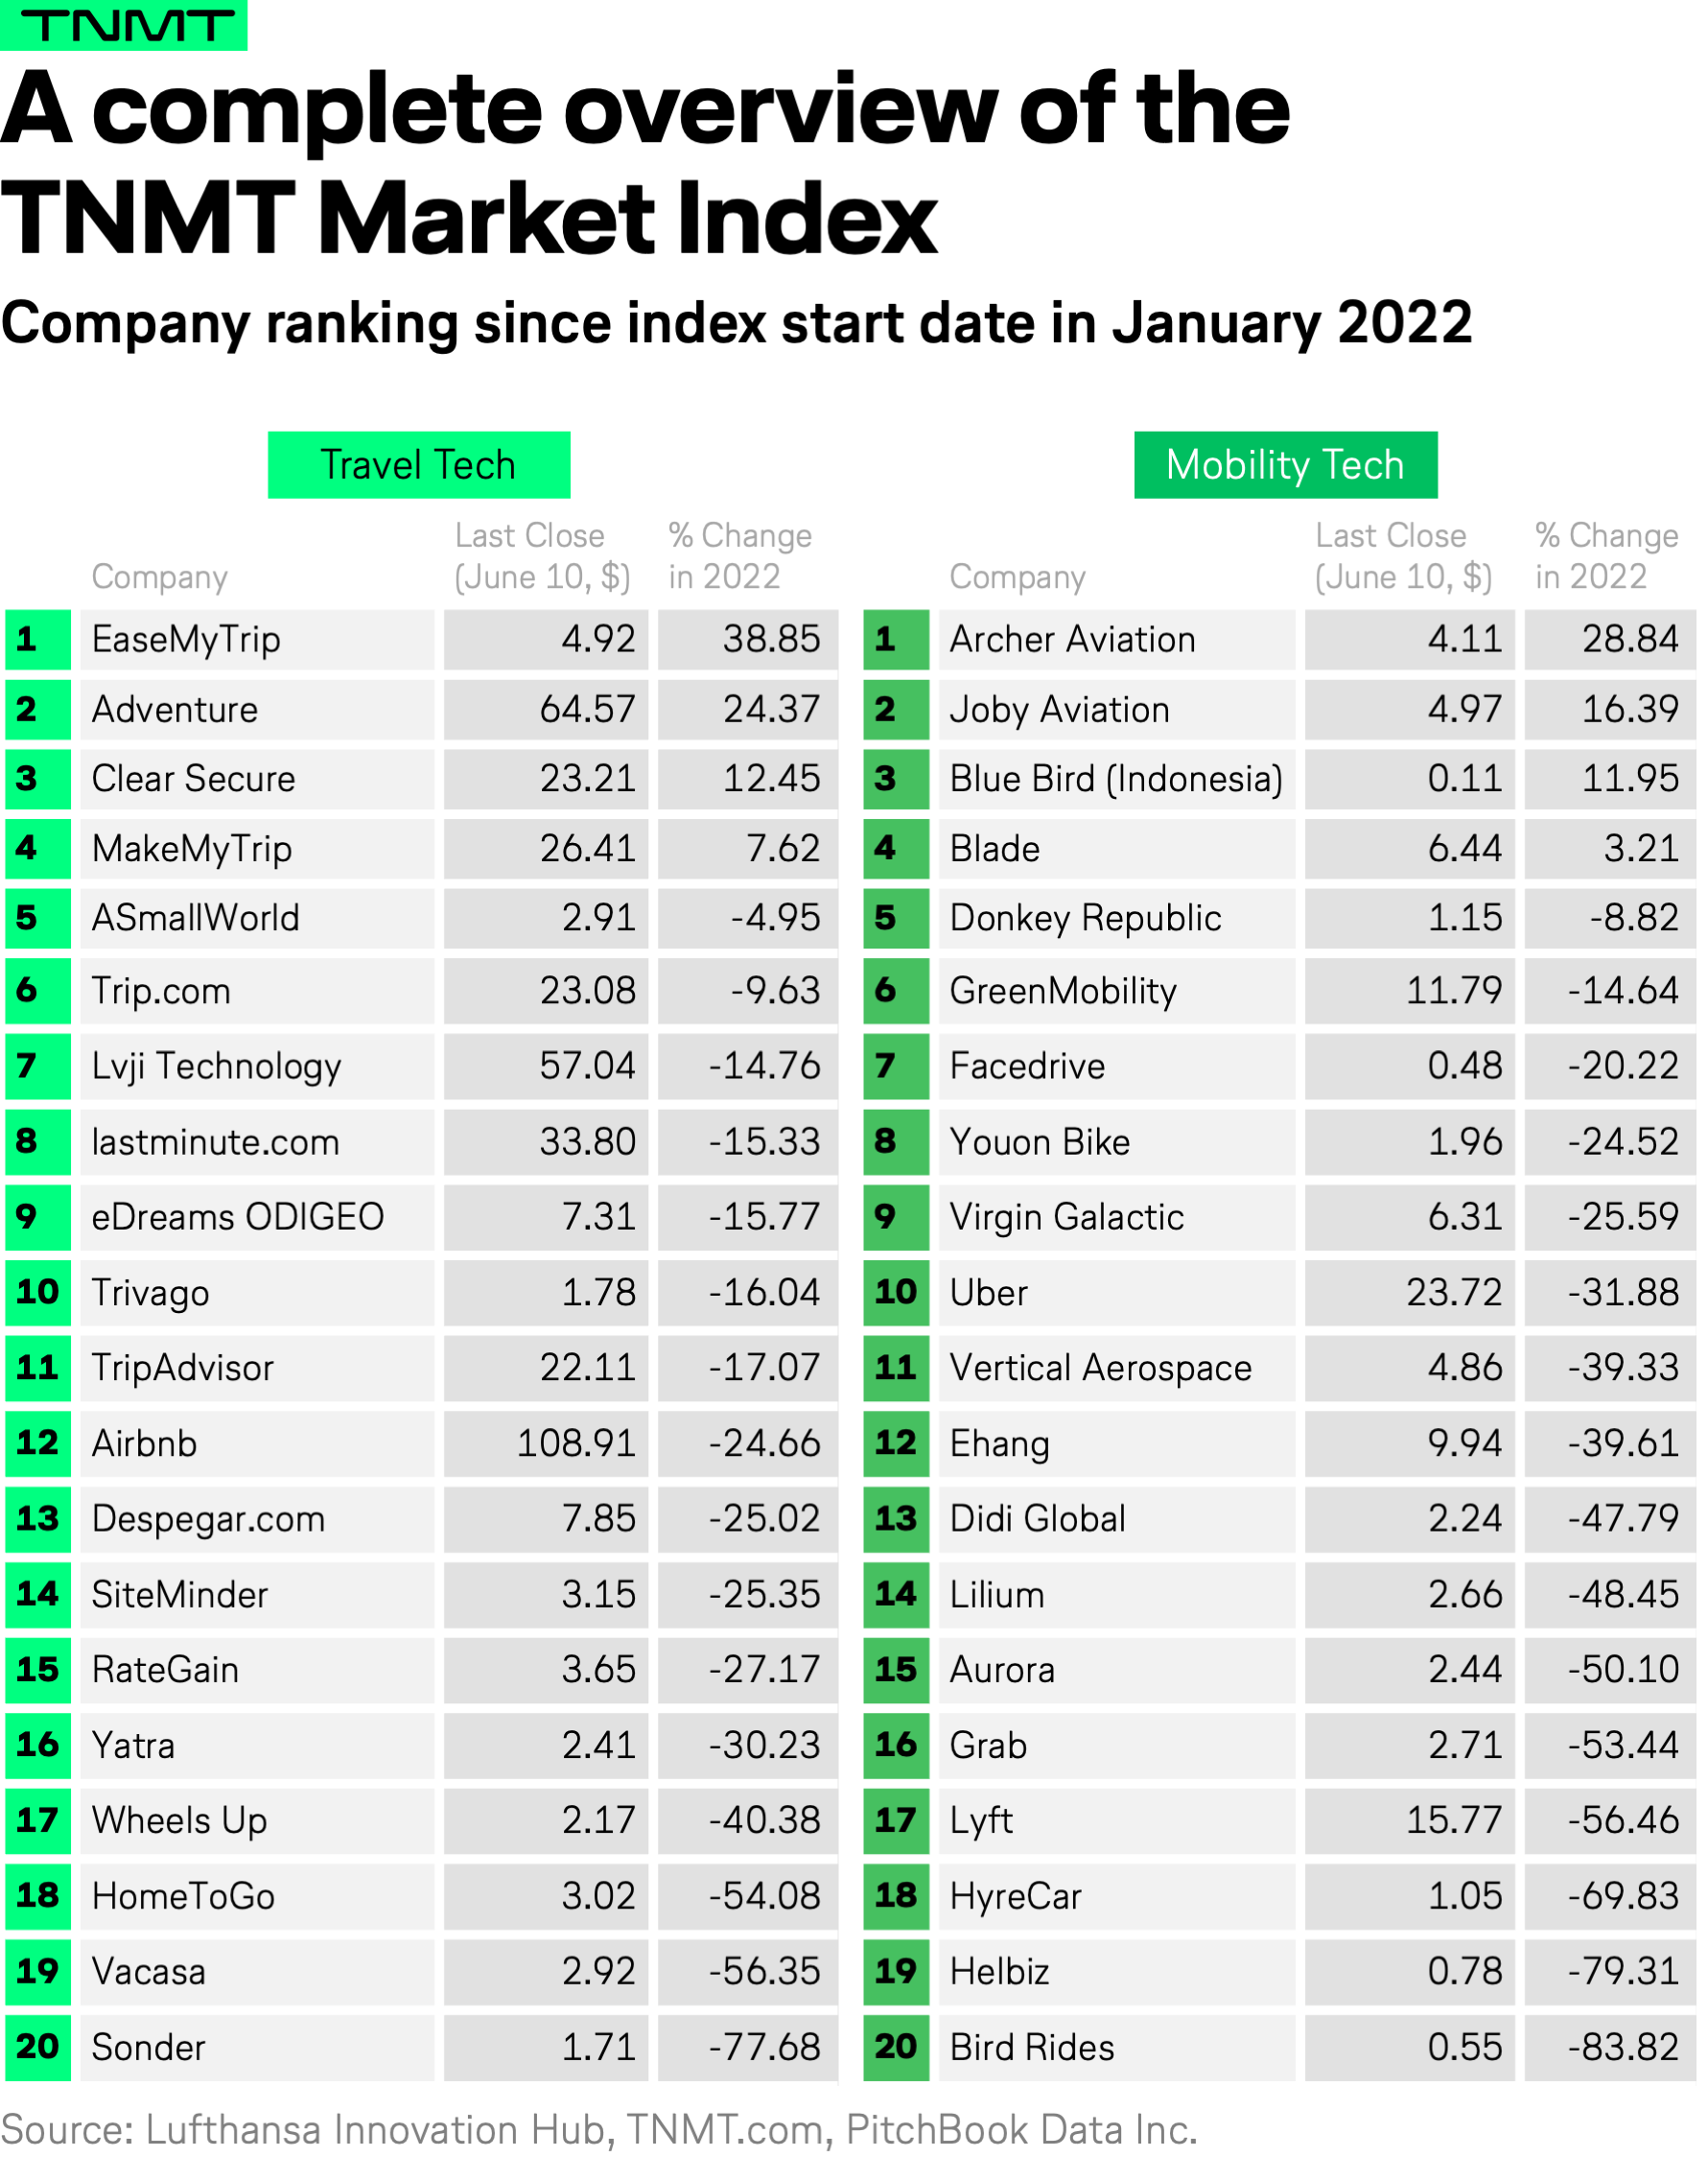
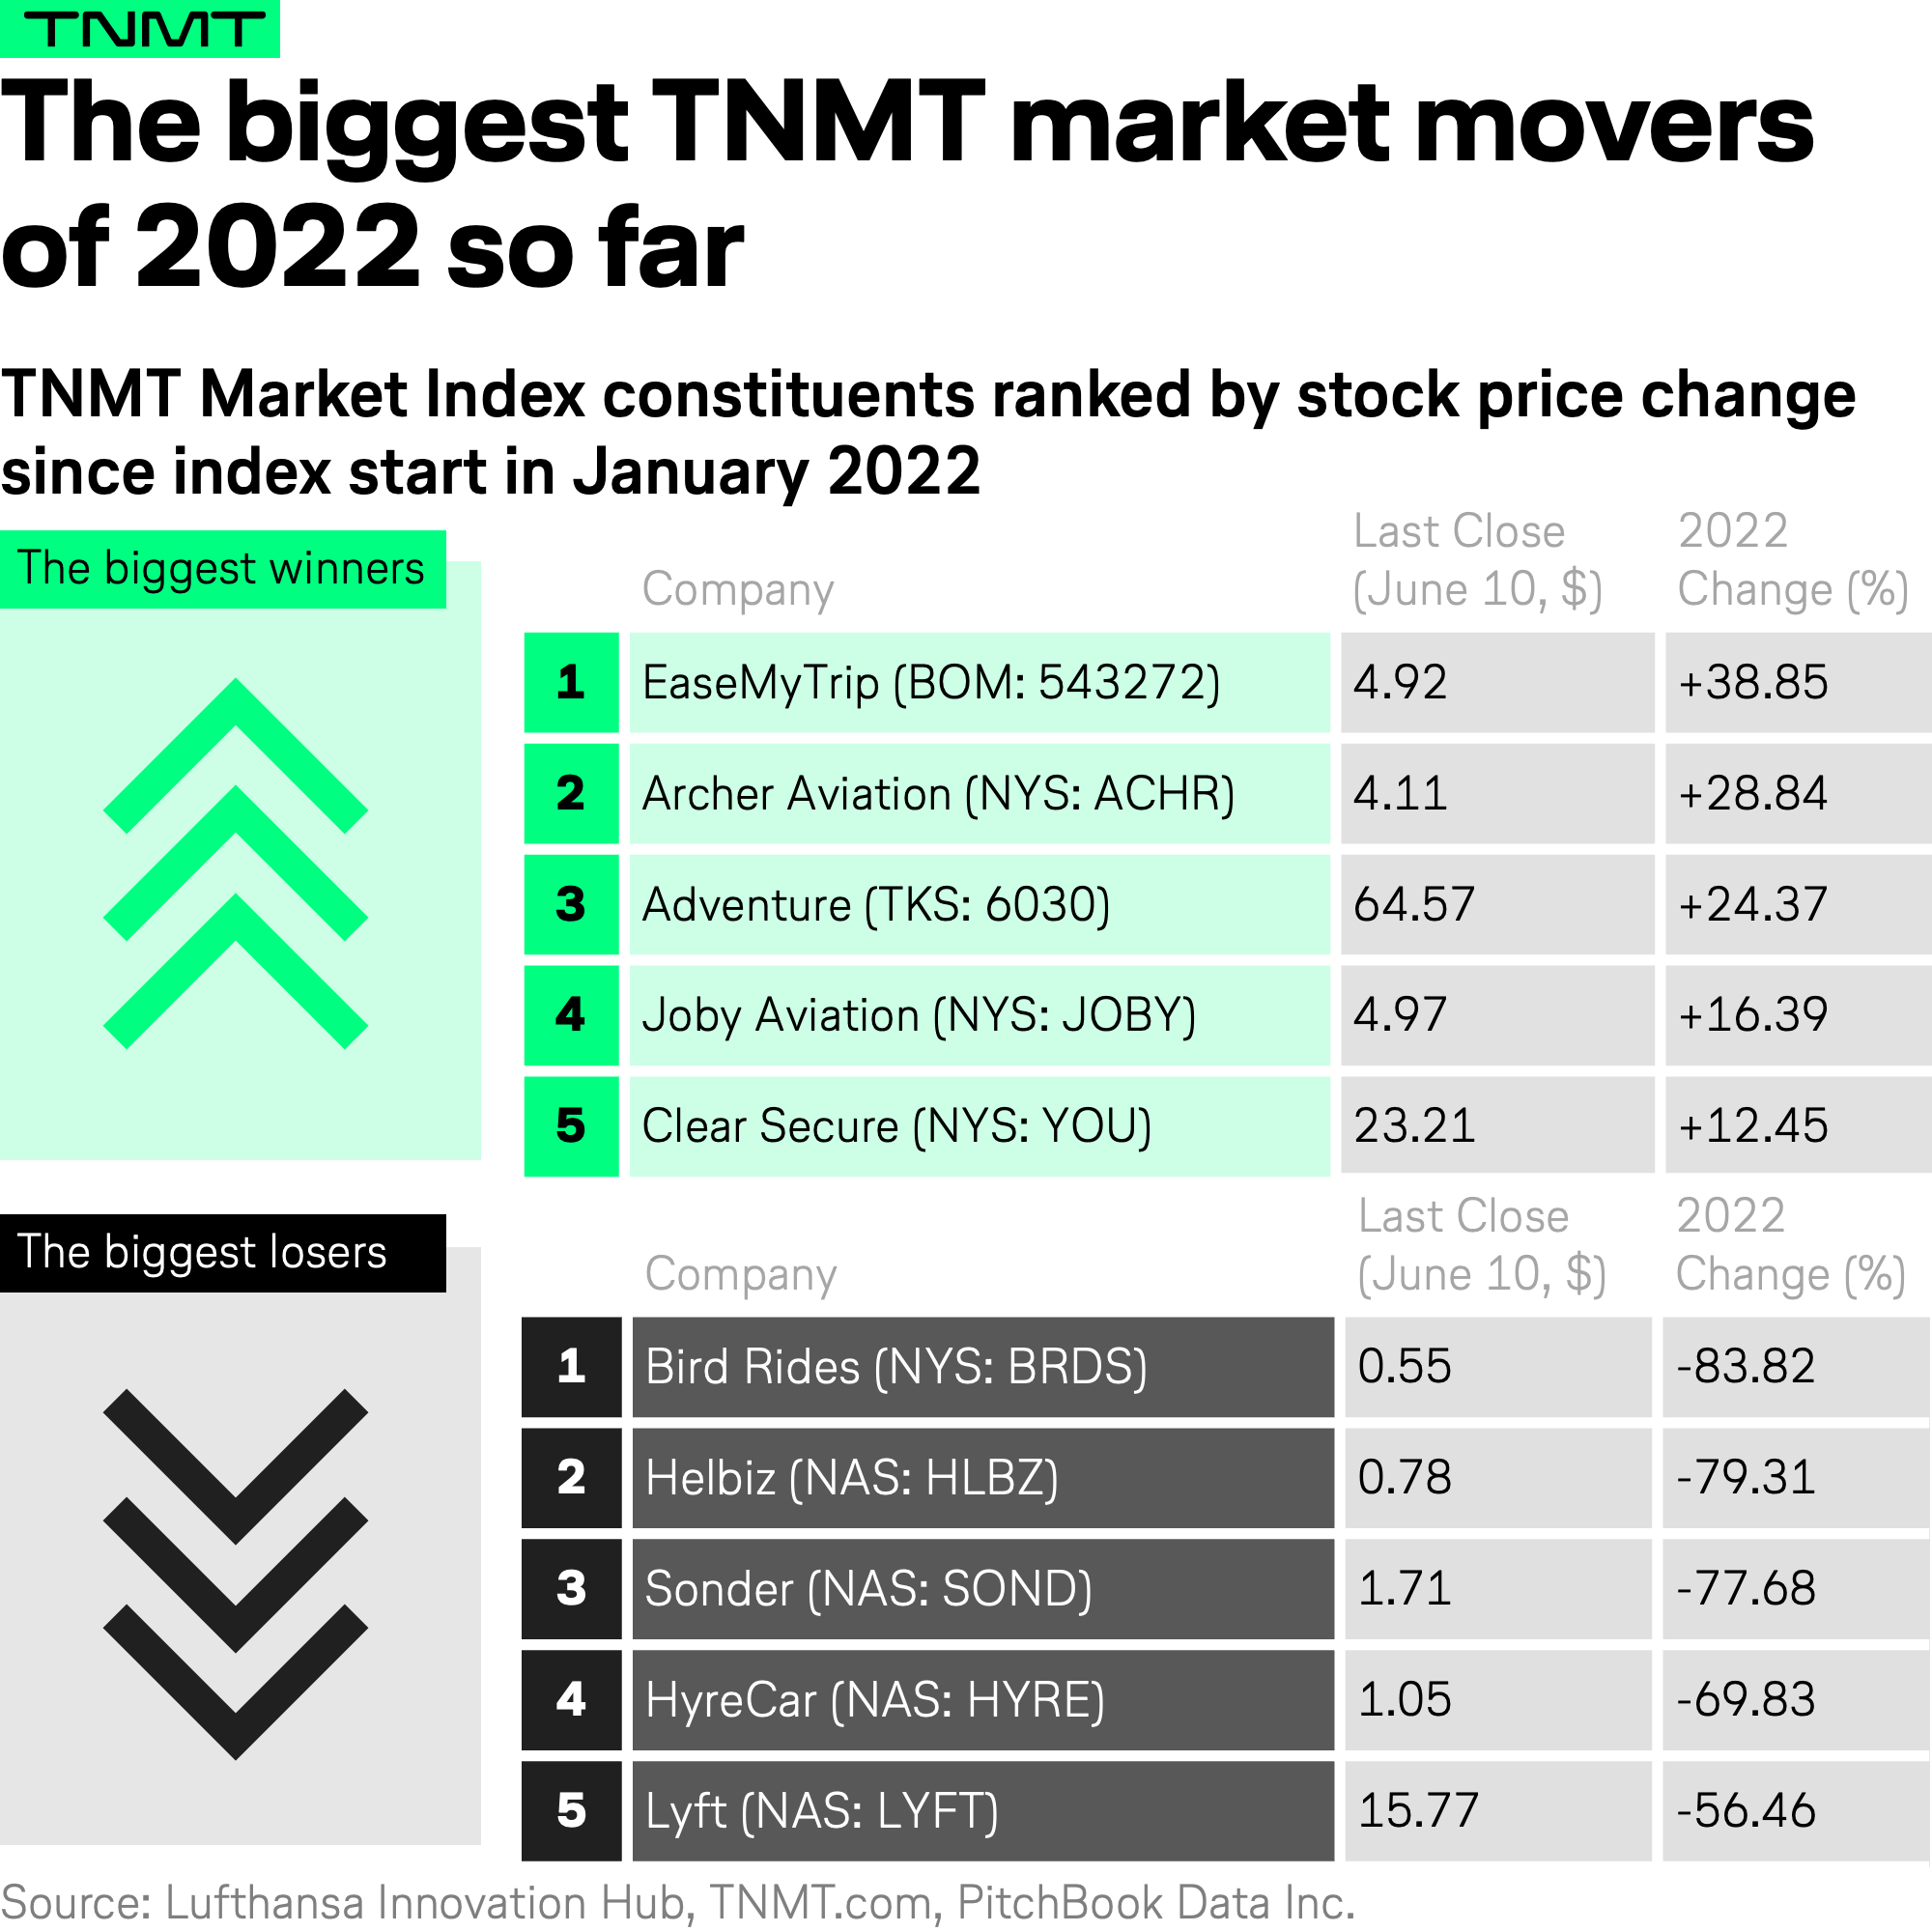
For a more nuanced analysis, here is a detailed breakdown of the year-to-date performances of all the 40 companies that make up the TNMT Market Index.
As you will see in the YTD comparison for Jun 10th, only eight companies were able to gain in market value—a clear tribute to the market downturn of the past two months.
Let’s take a closer look at the different types of companies part of our TNMT Market Index.
Mega companies drive the market-cap-weighted index
Let’s get something straight: not all TNMT Market Index constituents fall and rise in the same manner and this impacts the two versions of the index in different ways.
First, it’s important to note that the major players in the market-cap-weighted TNMT Index, including Airbnb, Uber, Trip.com, Lyft, Grab, and Didi, tend to be the ones making distinct market movements visible, as we previously explained.
You might be wondering why.
Well, let’s explore how major companies drive index development. Airbnb, which is the market-cap leader, is a great example. Here are two scenarios that evidence why:
Scenario 1 (or the David vs. Goliath scenario) describes the time period between February 9 and 15, 2022. This week, the market-cap-weighted TNMT Market Index shows two pinnacles and one low. The reason for these fluctuations is simple. This development is in line with overall stock market performance and is visible in the S&P 500. On February 9, big tech stocks and real estate were hot commodities. However, both took a nosedive as a result of the world’s anxiety over the Russian invasion of Ukraine. Finally, these asset segments gained positive momentum once more following the announcement from the FED that it will raise interest rates.
During this time, Airbnb’s market cap fell by $1 billion USD to less than $108 billion USD on February 14, then rose again to $118 billion USD on February 15. Altogether, this makes for an almost $10 billion USD shift. Such a shift alone is far higher than the average market cap of the stocks in our index. At $300 billion USD+ in total market cap, we’re looking at an average of $7.5 billion USD in market cap per index title. And this is not even particularly small—the TNMT Index title with the smallest market cap is Donkey Republic, with less than $20 million USD. This amount is only a tiny fraction of Airbnb’s $100 billion USD market cap. As a result, it has little to no impact on the development of the market-cap-weighted index.
Scenario 2 (or the Media and Hype scenario) refers to April 28, 2022. On this day, the market-cap-weighted Travel-Tech Sub-Index jumped 10% in value—see our full TNMT Market Index Dashboard. This was mostly due to a single company event, which is another manner in which a major company can significantly impact the index.
To explain: on April 28, 2022, Airbnb’s stock saw a slight increase from $152 to $159 USD. This $7 USD increase had a major impact on our index. It likely stemmed from Airbnb announcing that its staff can now work remotely from anywhere in the world—a revolutionary approach amid a new era in work culture. On the same day, Airbnb was one of four travel technology stocks that saw a measurable increase. The other three companies were Clear Secure, Sonder, and WheelsUp, which together had an aggregate market cap of less than $4.5 billion USD. It is safe to say that Airbnb’s $100+ billion USD market cap contributed significantly more to the index movement of that day.
Stock market depression hits Travel and Mobility Tech—or does it?
As we have previously hinted, the trajectory of the overall stock market cannot be dismissed as a factor influencing the TNMT Market Index. In particular, Wall Street’s losing streak, which began in late March, caused the S&P 500 to drop by more than 20%.
During this period, the TNMT equal-weighted Index performed far better than the market-cap-weighted index.
What does this mean?
Not all stocks in our index were affected in such a negative way. In fact, TNMT stocks, despite a slight downward trend, maintained a relatively stable index value over the past few weeks. This level of stability is visible in the Mobility-Tech and Travel-Tech equal-weighted subindices (see the full TNMT Index Dashboard), both of which, since April, have not dropped below an index value of 93.
In fact, between April and June, the equal-weighted TNMT index consistently outperformed the S&P 500.
Now, the S&P 500 is actually a cap-weighted index so not entirely comparable to an equal-weighted index. However, when we compare apples to apples and use the S&P 500 Equal Weight Index (see details here), we see a similar trend: our TNMT index performed better over the past few months, particularly so in May.
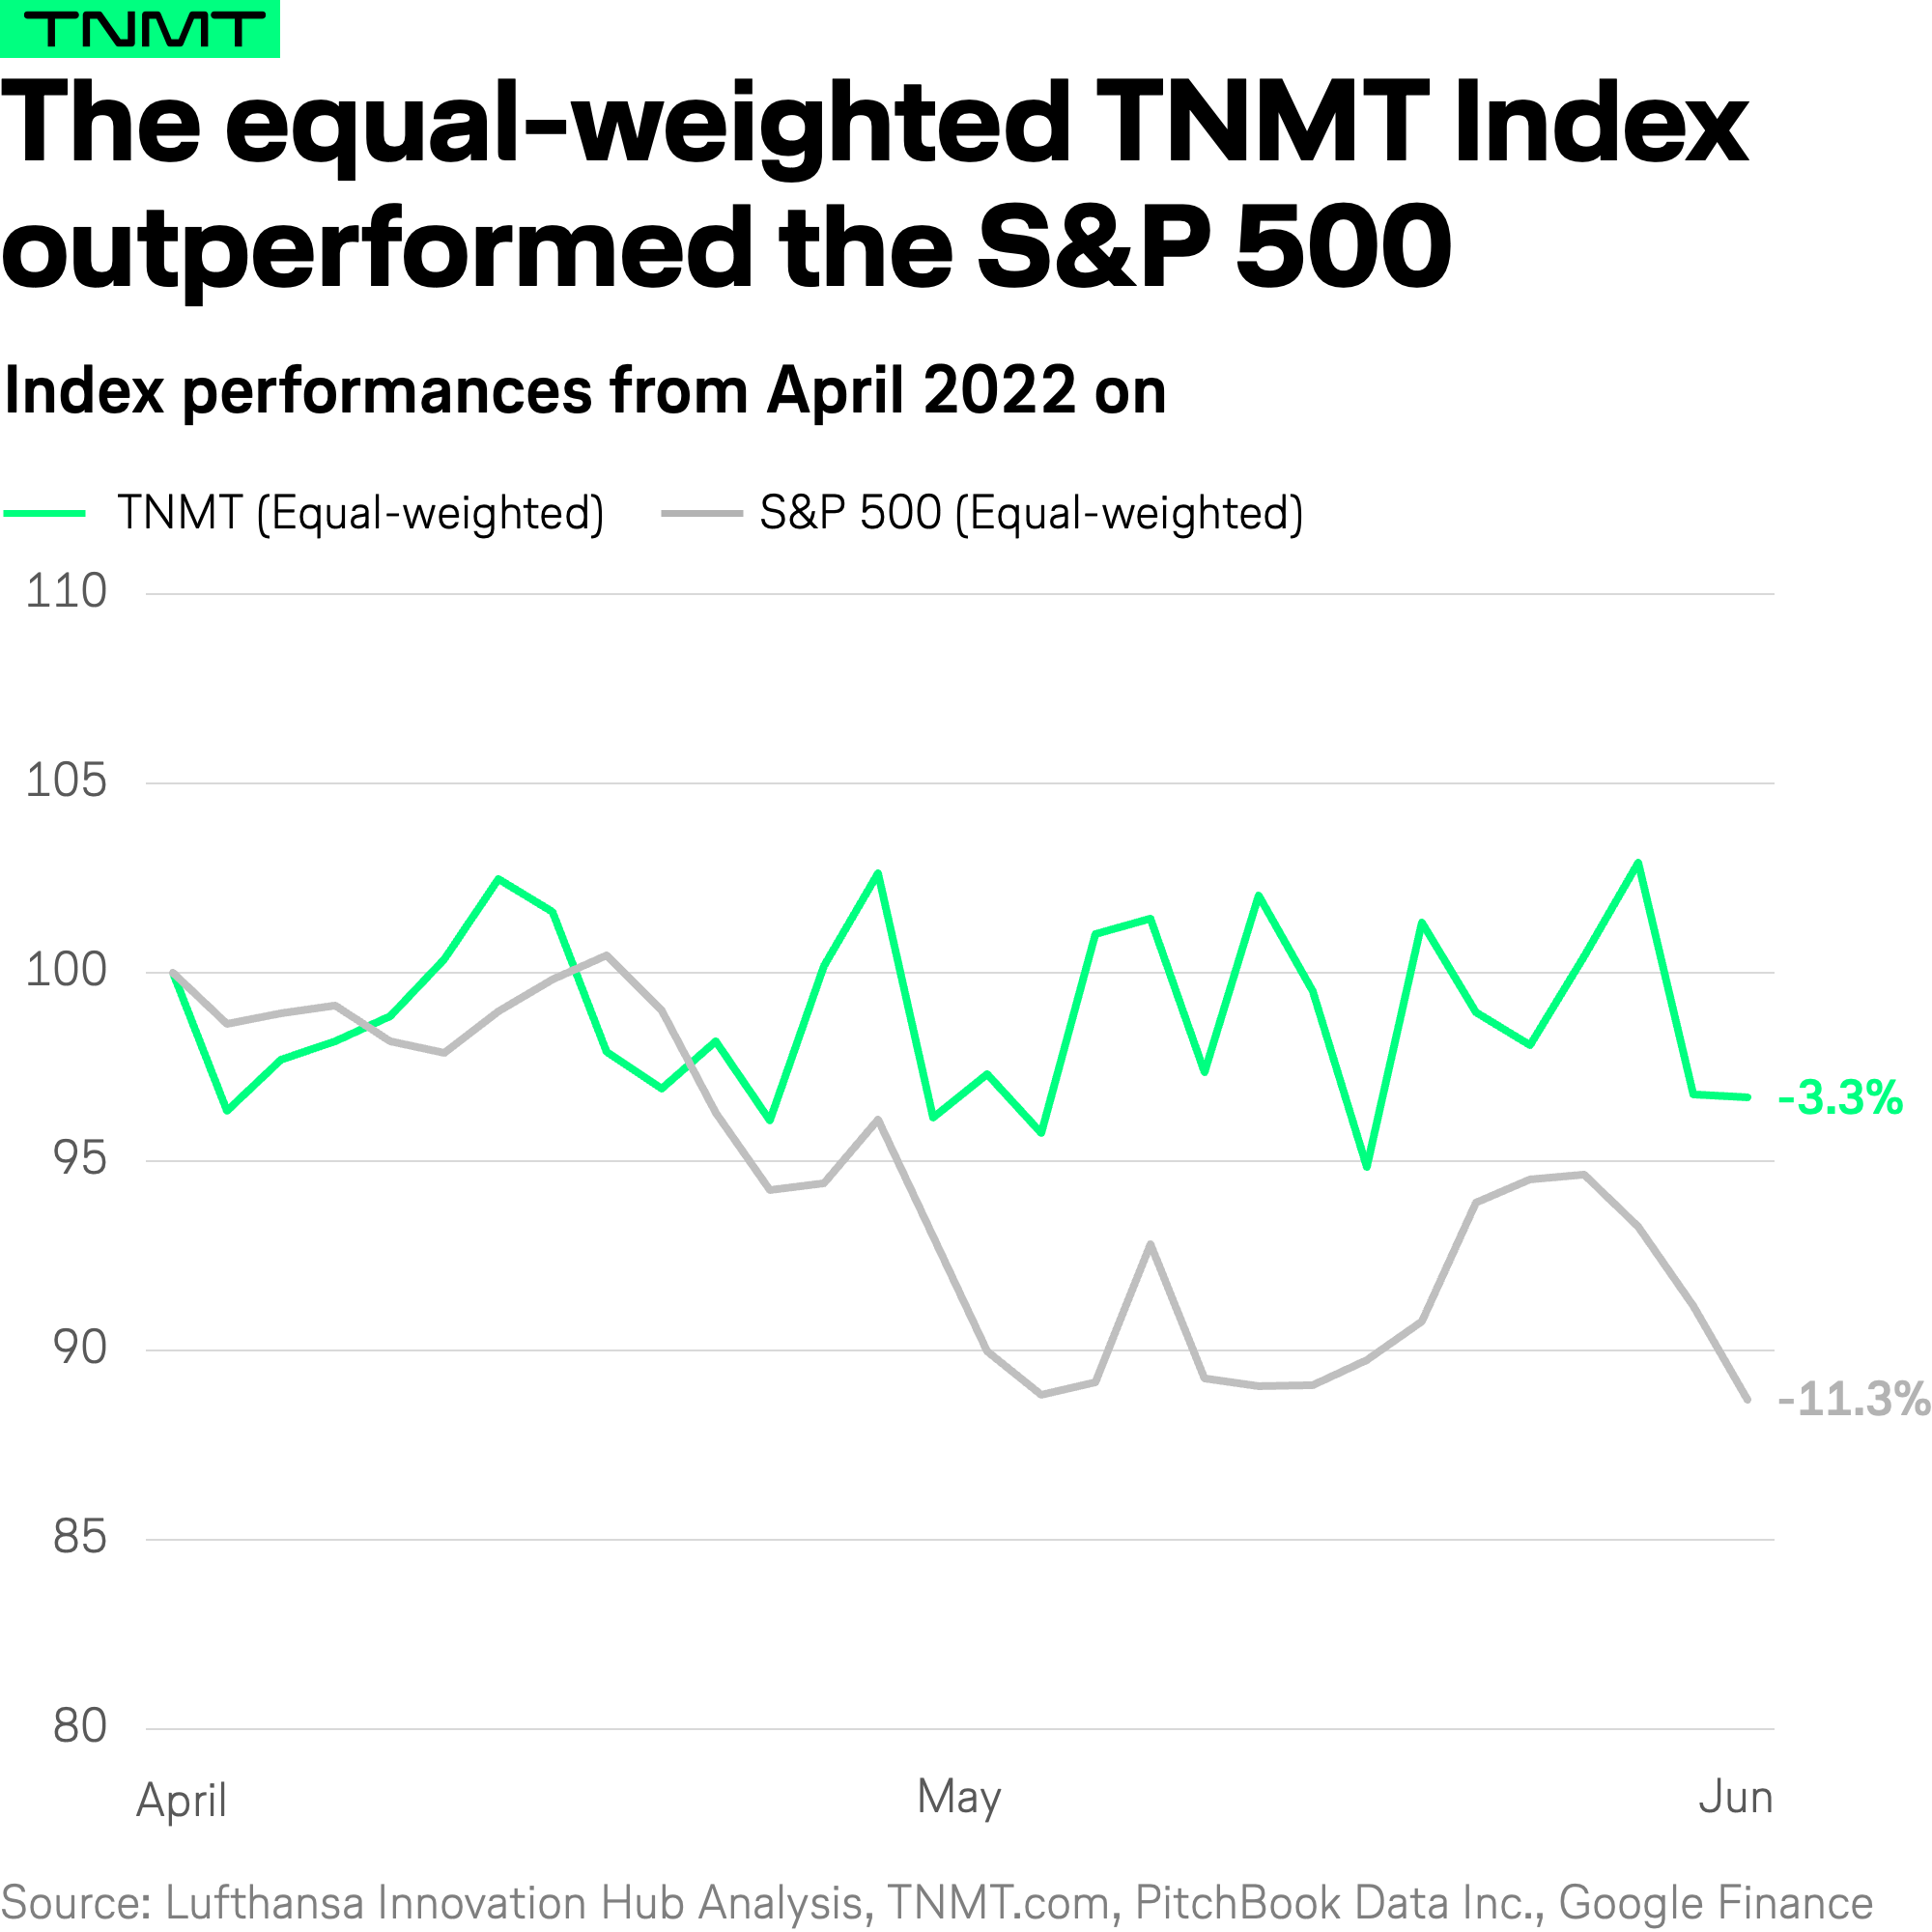
Please note, to further emphasize this development, we have indexed both the S&P 500 equal-weighted index and our TNMT index as of April 1, 2022, which means the index values might differ slightly from our webpage dashboard.
The level of stability shown above has several positive takeaways in regards to the health of the public Travel and Mobility Tech sector, which include:
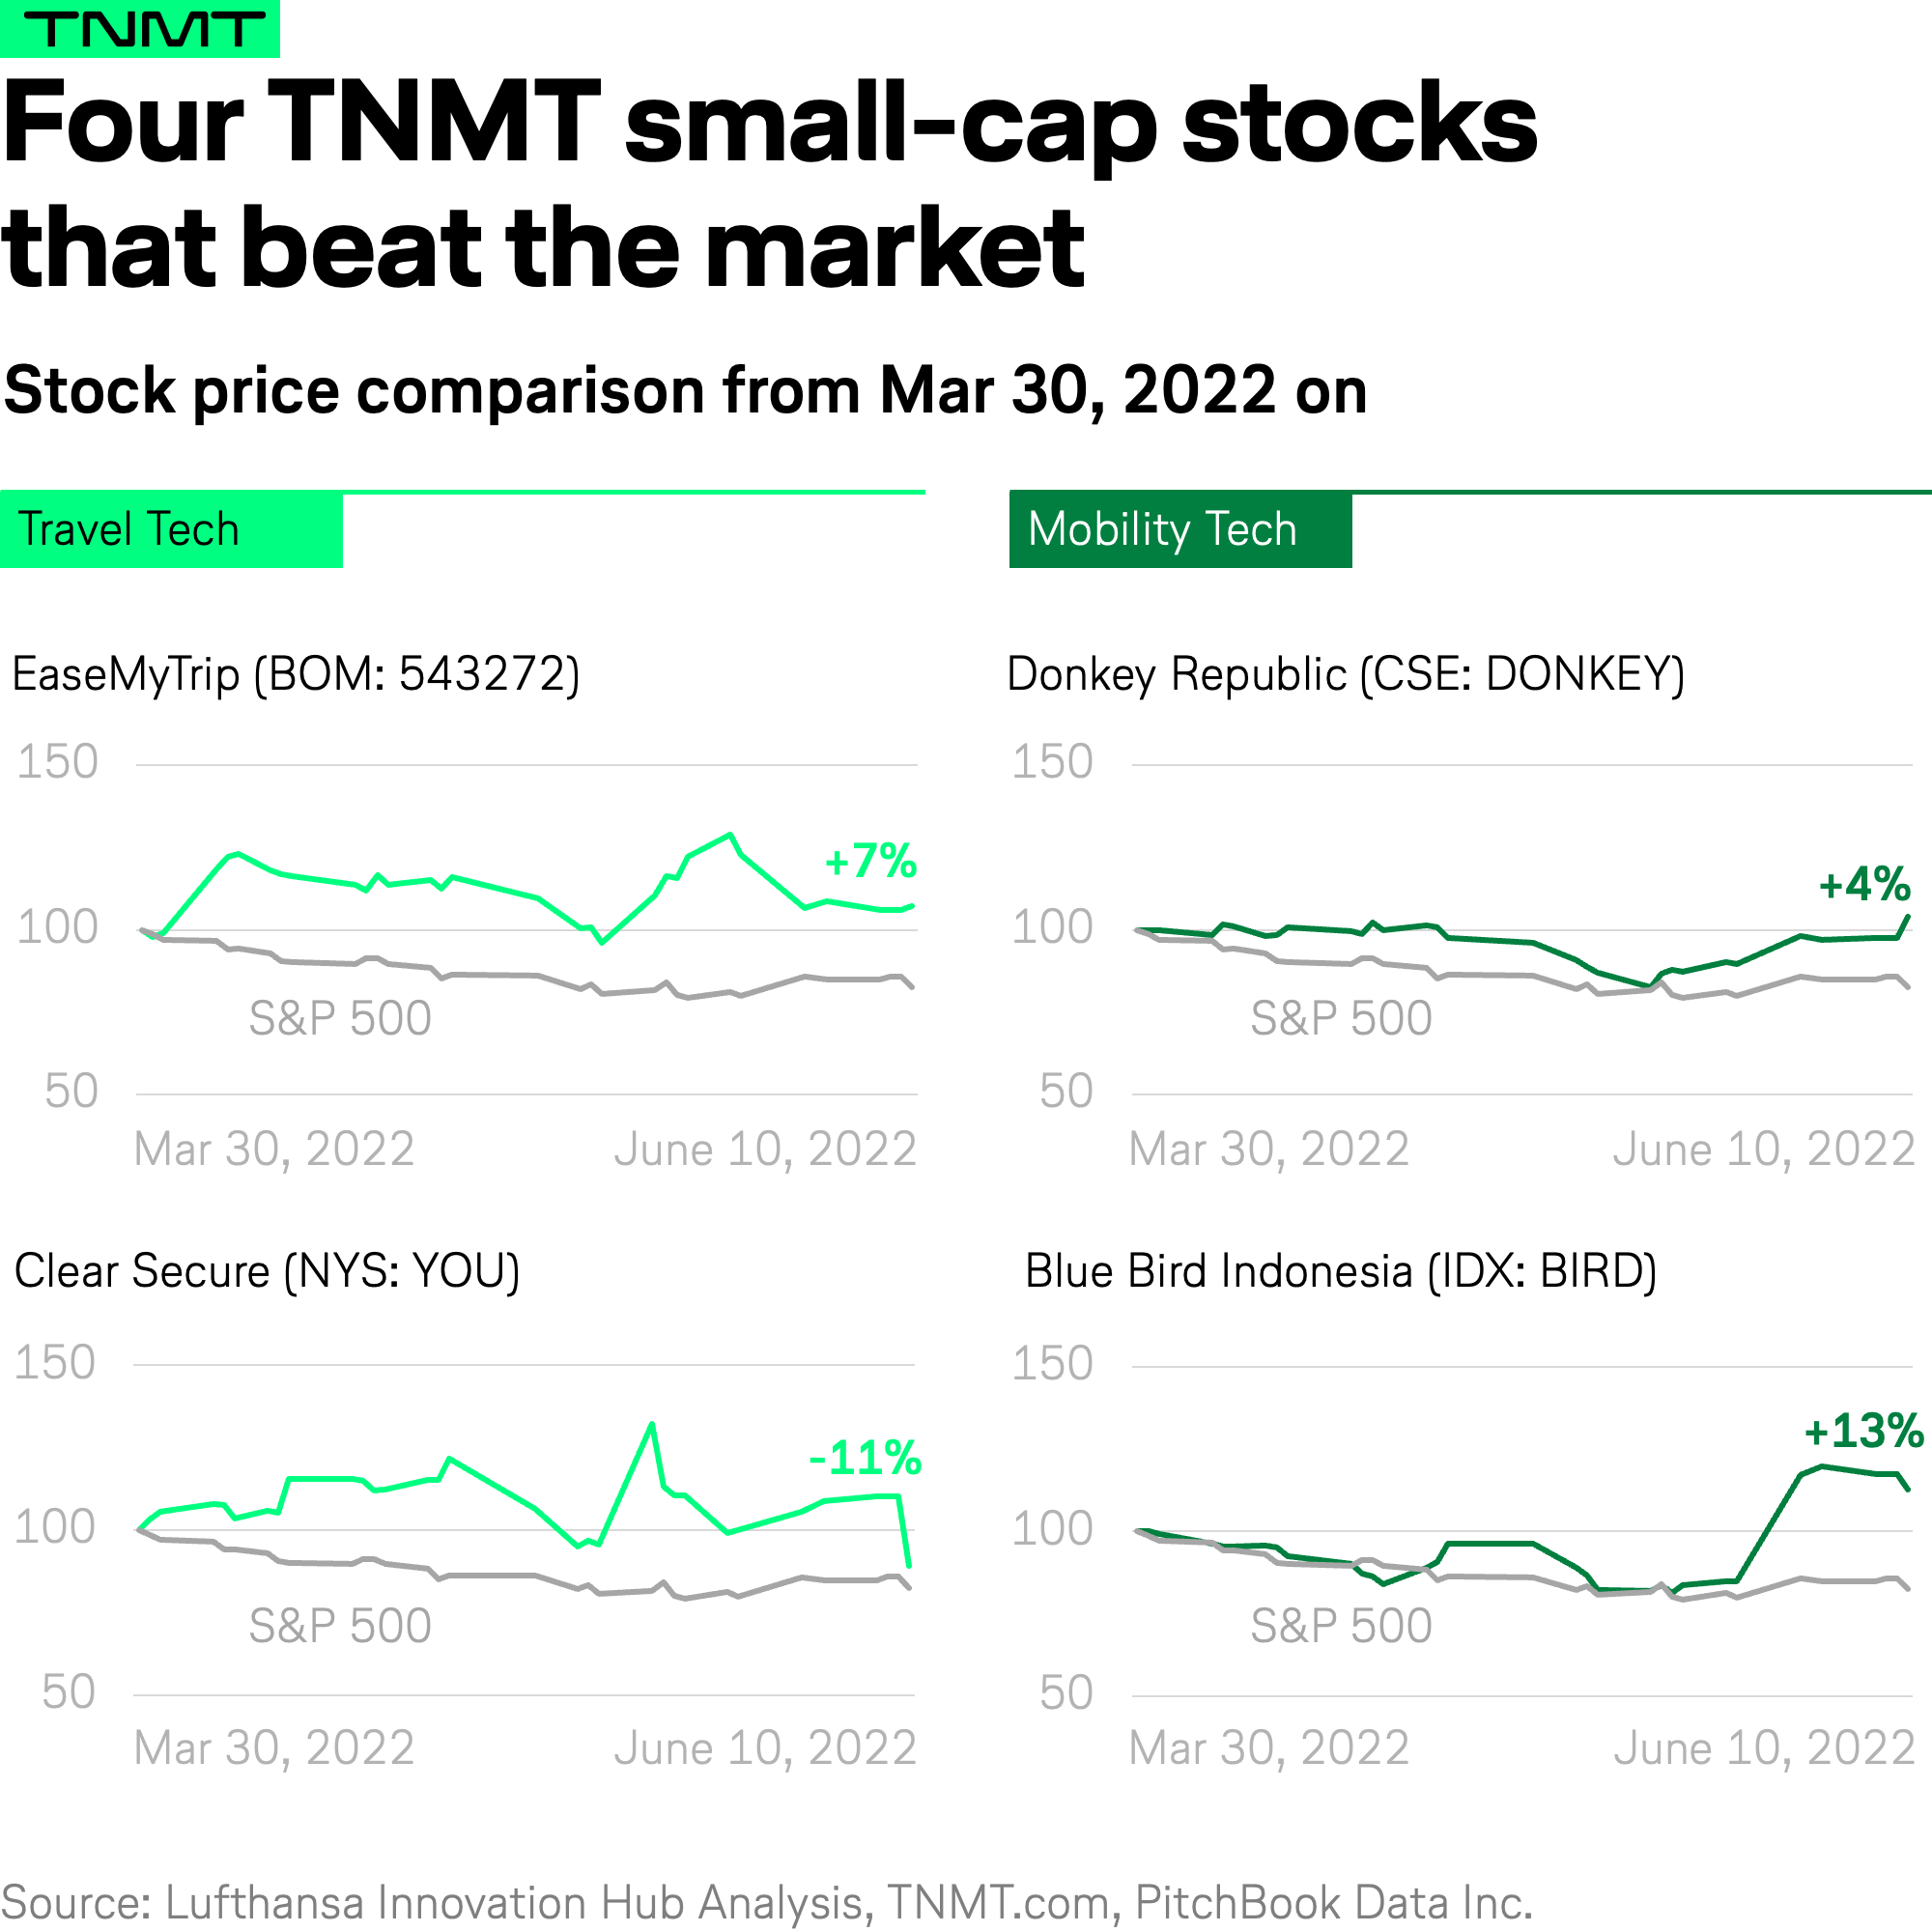
- Despite a general stock market downturn, TNMT stocks, on average, have remained relatively stable. While this is not so much the case for big market cap stocks, the smaller constituents in our index have weathered market conditions quite well.
- This is impressive given that travel is still facing the repercussions of the global pandemic. While this is the case, many of our analyses have evidenced that pre-pandemic travel levels are likely to return. Although the world is fearing a global recession, travel is booming.
- Moreover, the travel investor community seems to have faith, especially in smaller travel and mobility players. Such faith has been exemplified through the successes of our constituents, which have shown hardly any signs of struggle and have maintained a positive price trajectory across the past few months. For example, Archer Aviation, Blue Bird (Indonesia), Clear Secure, EaseMyTrip, Joby Aviation, and MakeMyTrip have remained stable or have had their stock prices increase during the height of the 2022 stock-market depression.
So, what’s next?
It’s no secret that stock markets have had a rough 2022, especially from Q2 on.
That said, the fact that travel and mobility stocks in our equal-weighted TNMT Index have barely suffered as a result of the depression is a positive sign for the industry as a whole.
Whether this will lay the foundation for a continued level of stability or even an upward trend remains to be seen. However, what’s important to remember is that we are only at the beginning of a new era in the Travel and Mobility Tech sector.
Not only have we just started tracking index development but it is safe to say that we are witnessing an industry in constant flux.
Will this industry succeed and recuperate some of its pre-COVD trajectory?
And will the winners of the past six months remain at the top of the TNMT table?
Stay tuned to find out more. And don’t worry. We’ll keep you informed.
Feel free to bookmark our TNMT Market Index Dashboard and sign up for our TNMT Newsletter for regular updates.
This content is for informational purposes only and should not be used as investment advice.