A few weeks ago, we published the Transit-Station Mobility Tracker where we tried to predict those countries that will be fastest to reflate their travel activity. Fast forward to today and most countries in Europe have eased or lifted lockdown restrictions. We were curious to see how is this reflected in actual movement data and whether there are differences between European countries.
Levering Google Map’s free mobility reports, we proxied transit mobility (movement to transit hubs such as metro, bus, and train stations) as consumer sentiment for traveling as we believe that transit hubs are the starting point for many trips that go beyond the borders of a city.
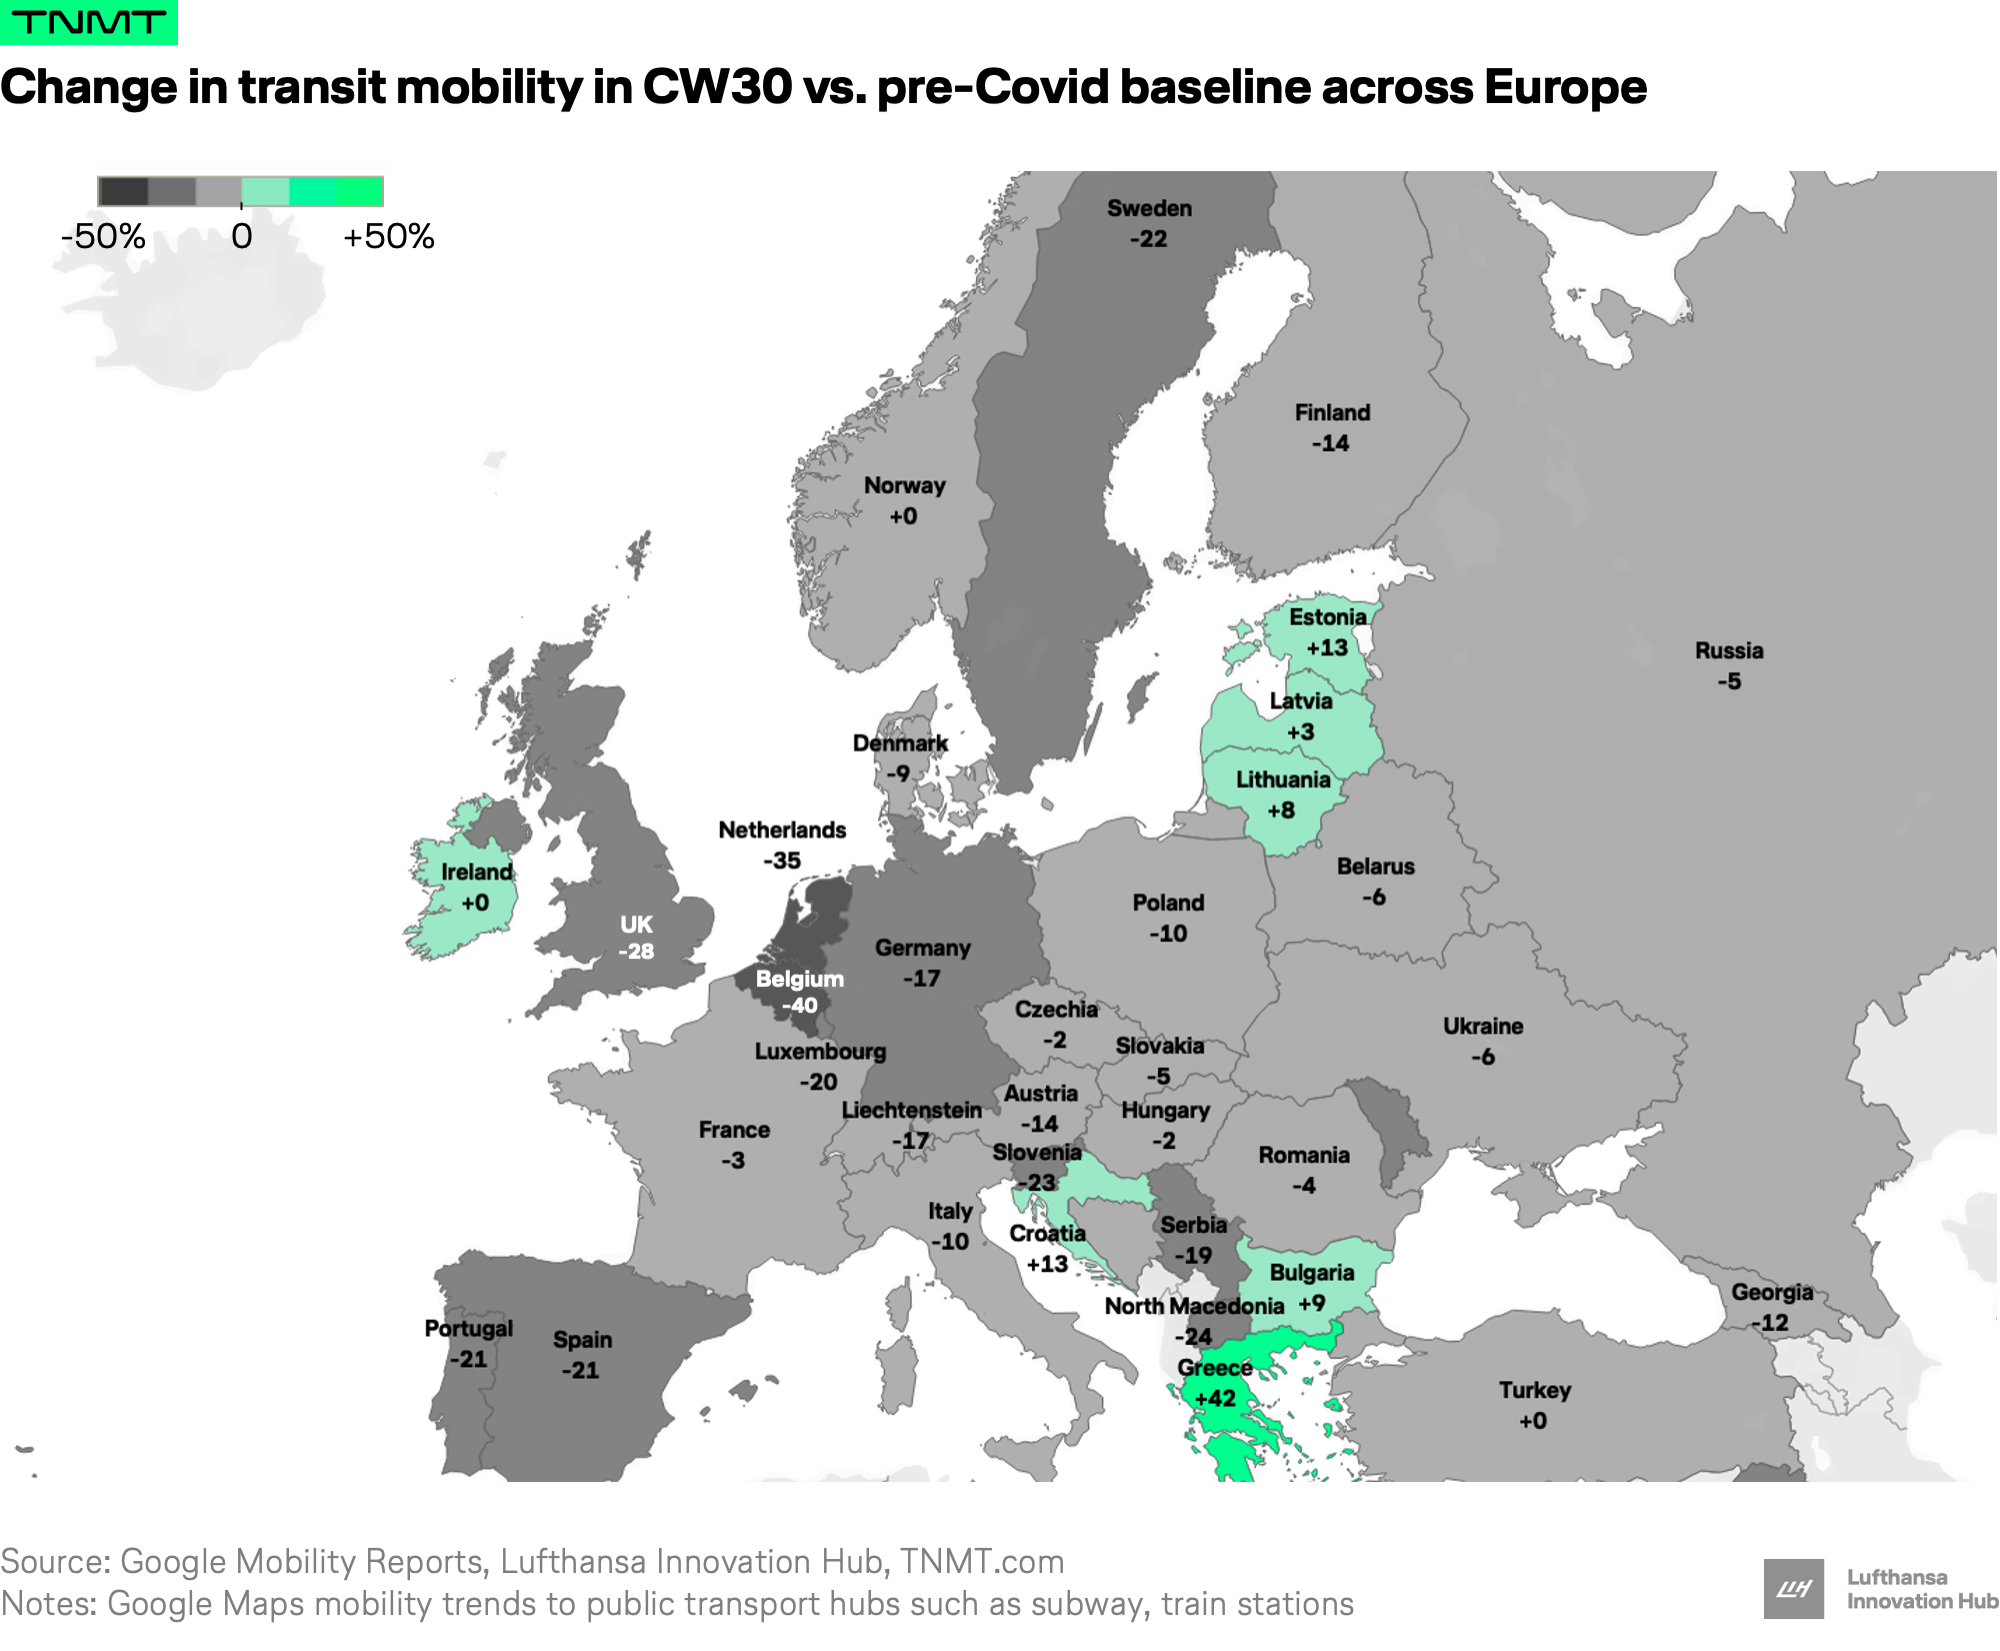
Taking a brief look at Europe, we could categorize countries in Europe into three groups with distinct transit mobility trends.

- Countries with a positive transit mobility delta (green-shaded on the map) are back to pre-covid levels or even surpassing them. These are the Baltic countries, few in the Mediterranean (Greece, Croatia, Bulgaria) as well as Ireland.
- Countries with a negative delta that resumed transit mobility but lower than before the crisis (light- to medium-grey areas). The majority of European countries fall into this group.
- Countries that still seem to be deeply stuck in lockdown mode given their negative transit mobility deltas compared to pre-crisis values (dark-grey-shaded). Only a few countries currently belong to this group such as Belgium and the Netherlands.
Besides these three groups with distinct mobility trends, some other main takeaways the graphic offers:
- Greece shows the highest transit mobility across Europe, probably also driven by the growing number of tourists entering the country.
- Eastern Europe displays higher transit mobility movements than Central Europe suggesting people in Central Europe are more cautious.
- The Benelux countries show the lowest transit mobility behaviour (-30 to -40% delta). Since most restrictions were already eased in May, this suggests people are extremely cautious to travel again, even for short-distances across cities.
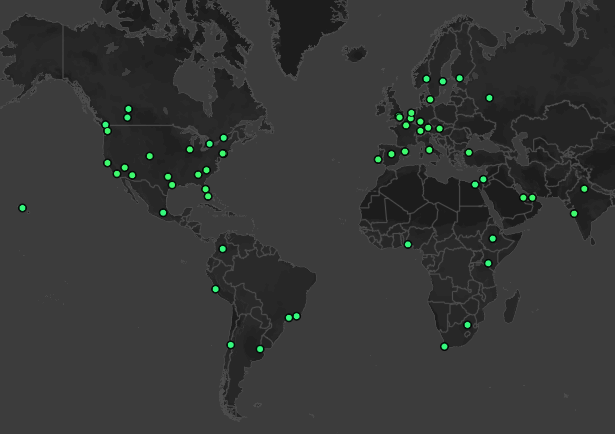
Beyond our European snapshot, the Google dataset reports on 130+ countries across the globe. We built a comprehensive data dashboard that provides a worldwide overview (access here).


