Note: A follow-up article to this analysis can be found here.
There’s a question everyone, especially in the travel industry, is asking right now: how long will it be until people are allowed to travel again? And when they are, how long will it take for travel bookings to return to pre-crisis levels?
To provide some hints in answering these questions, we ran an unconventional data analysis to predict how long travel bookings will continue to decline based on learnings from various travel sectors and how they performed in China since the outbreak of the virus in December.
What unconventional method did we use exactly? First, we looked at Chinese app-download trends across the major categories in Travel and Mobility Tech – namely air travel, online search and booking, accommodations (hotels and apartments), urban mobility (bike-, car- and ride-sharing) as well as tours and activities. For each sector, we selected the top five mobile apps based on app download volumes within the last 12 weeks in China. We then calculated the week-over-week change in app downloads and smoothed the trend lines by using a two-week moving average. The results are promising and provide some much-needed optimism.
Let’s start with air travel by looking at download trends for airline apps.
Chinese travelers are getting ready to travel again
At the time of writing this article (March 26), China is in the midst of ending travel restrictions in Hubei, the province where Covid-19 first emerged. Starting this week, healthy residents will be allowed to travel outside of their province again, and it seems as if they are not the only ones in China looking forward to that freedom.
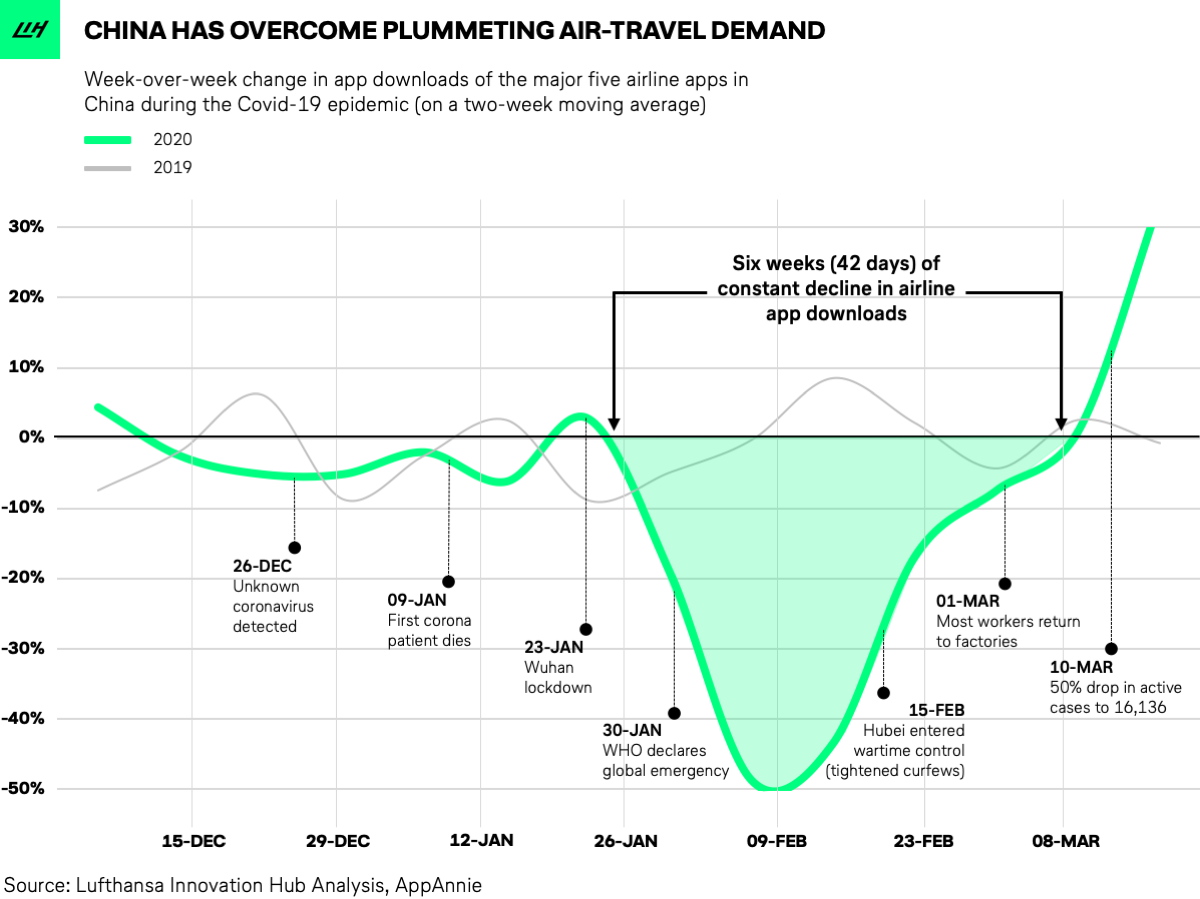
According to weekly changes in airline-app downloads, we see a clear pattern in our analysis: an almost perfect V-Curve. It is characterized by a rapid and abrupt slump in app downloads, all the way down to a negative 50% week-over-week decline in the week of Feb 9th, with just as much of a rapid uptake shortly after, reaching positive growth rates (compared to the previous week) in the week of March 8th – about 42 days, or roughly 6 weeks after constant declines.

42 days of constant decline is certainly a devastating development. But given the scope of the virus and its consequences, 42 days of plummeting downloads also sounds like a timeframe that can be overcome by airlines that have a healthy financial foundation. It’s important to emphasize here: the above graphic plots week-over-week changes in app downloads, not absolute download volume. China’s absolute weekly downloads in March are still far away from pre-crisis levels. What the graphic does show, however, is that the initial shock has been overcome quite rapidly as more people download airline apps per week than the respective weeks before.
What we also find highly interesting is the fact that the recovery mode set in almost immediately after China had resumed business operations in all 30 mainland provinces (except for Hubei) on February 10th, even before the infection rate reached its all-time peak on Feb 17th. It seems that the moment restrictions are lifted, interest in travel soars again.
For instance, airline app download volumes in China have been up 73% since early March compared to its lowest point at the end of February. We suspect these app download trends highly correlate with the number of flight bookings as well as people getting mentally ready to travel again.
The most recent uptake in flight bookings is also backed by data from local Chinese travel search and data providers (e.g. eLong and Variflight) as well as China Travel News who reported seeing a significant increase in forward bookings for domestic air travel in China. Our findings and the ones reported from local travel agents suggest that Chinese tourists are planning and preparing for potential holidays in the coming months. We expect this to be limited to domestic travel for the time being, due to the many travel restrictions implemented by foreign governments.
Now, what does all this data mean for plummeting travel demand in Europe and the U.S.?
We expect to see similar trends in the West, depending on how effective current measures are at reducing the spread of Covid-19. Of course, it’s safe to assume that the shock-recovery time might take longer in the Western hemisphere, given the drastic measures taken by the Chinese government to contain Covid-19. While these measures are harder to implement in American and European democracies, we still believe the six-week recovery time to absorb the initial shock is a reasonable benchmark.
Recovery time varies by travel category
So far, we’ve only looked at data from airline mobile apps. Let’s expand the view and apply a more holistic perspective on the wider travel industry. What do the week-over-week app-download trends look like for OTAs, urban-mobility, accommodation, and tours and activities providers?
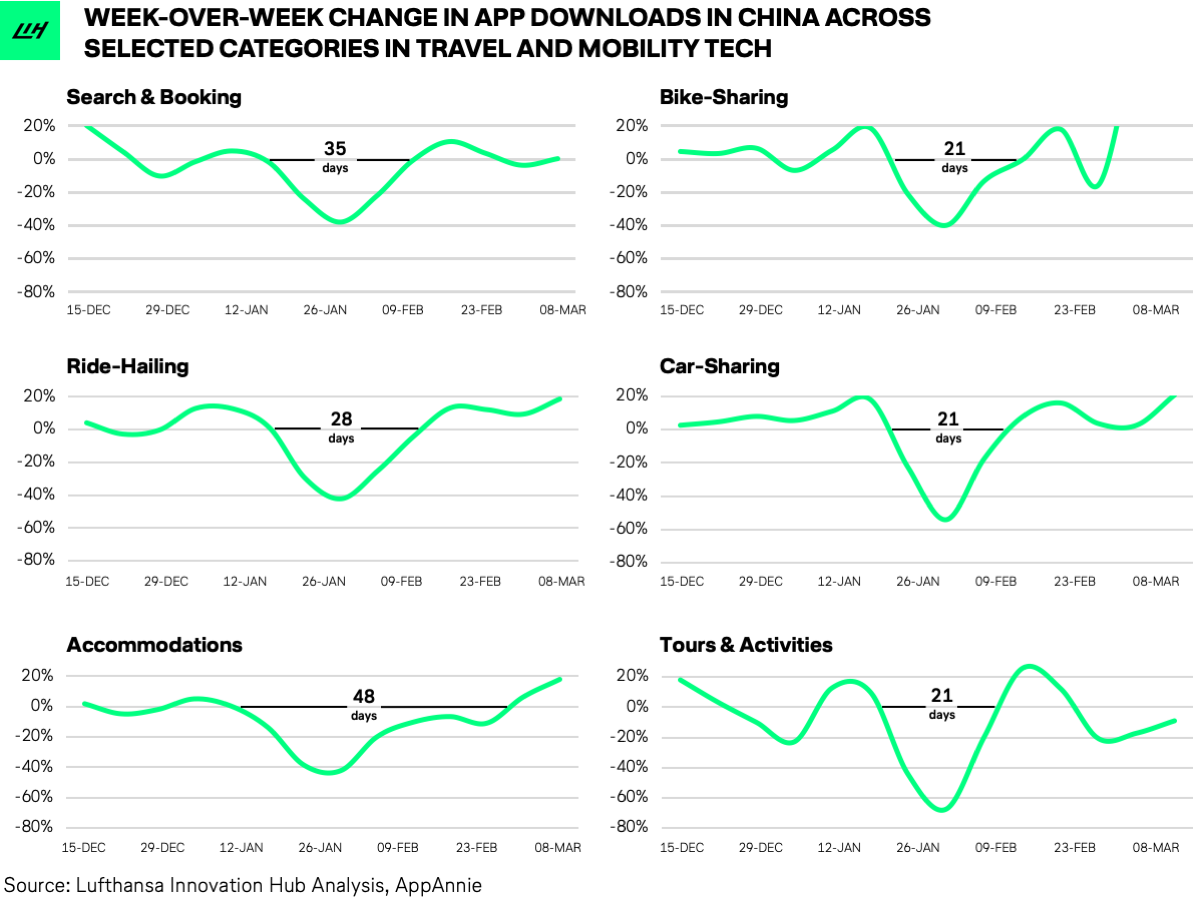
Sticking to the same methodology, we selected the five most downloaded mobile apps for each category and plotted week-over-week download trends. Here’s what that looks like:

As with our previous findings on airline apps, the V-curve is visible in all the Travel and Mobility Tech related categories. However, we do spot a difference in terms of the extent of the V-curve and the respective “recovery time”, i.e. the number of days in constant week-over-week declines.
Urban-mobility transport options such as e-bikes, car-sharing, and ride-hailing show the fastest recovery time of 21 to 28 days. Search and booking platforms (OTAs), as well as accommodation apps (e.g. hotels and apartments), show an average recovery period that is significantly longer (42 days).
So where does this difference come from? We assume that the faster recovery time for urban mobility is driven by the frequent and prevalent usage of those modes to enable movement in urban environments. People rely on them to get to work or move around town.
Travel bookings, on the other hand – be it flights, hotels, or entire travel packages – usually require a longer lead time and are less of a must-have in people’s daily lives. A business trip can be subsidized through a video conference call; the next vacation can be postponed – hence demand returned slower.
We sense a positive turning point
The positive developments in China give us hope for a similar V-like turnaround referring to absolute download levels and we hope to see similar trends also in Europe and the U.S. The prerequisite, of course, is that the spread of the coronavirus can be controlled so travel bans can be lifted and people feel confident enough to book a trip and step on a plane again.
There is no denying that we’ve yet to reach that recovery point in Europe and America. And headlines conveying worst-case scenarios like a year-long drought don’t help to alleviate our fears. Yet what’s inspiring about the concrete data from China is that the trends point to consumer interest in travel returning quicker than we all might think. We’ve seen that as soon as bans are lifted, consumer travel sentiment rises. The open question is to what degree and whether pre-crisis travel demand can be achieved in the foreseeable future. It’s way to early to make any predictions here.
But despite the current struggles, we remain optimistic that the travel industry can weather out the worst of the storm for four-to-eight weeks and then recover from the pandemic gradually.


