Infographic, May 11, 2021
Ranking all major urban transport modes based on their carbon-emission output.
Email
Article
An analysis of global airline startup investments shows fewer deals, fewer investors, and a growing gap to the innovation frontier.
Dive into the "Communities Define Demand" travel trend, exploring niche-focused demand, the review economy, and the rising luxification of travel.
Mapping the major new-air travel technologies on the Gartner-like hype cycle, including hydrogen and electric flying, air taxis, and many more.
Infographic
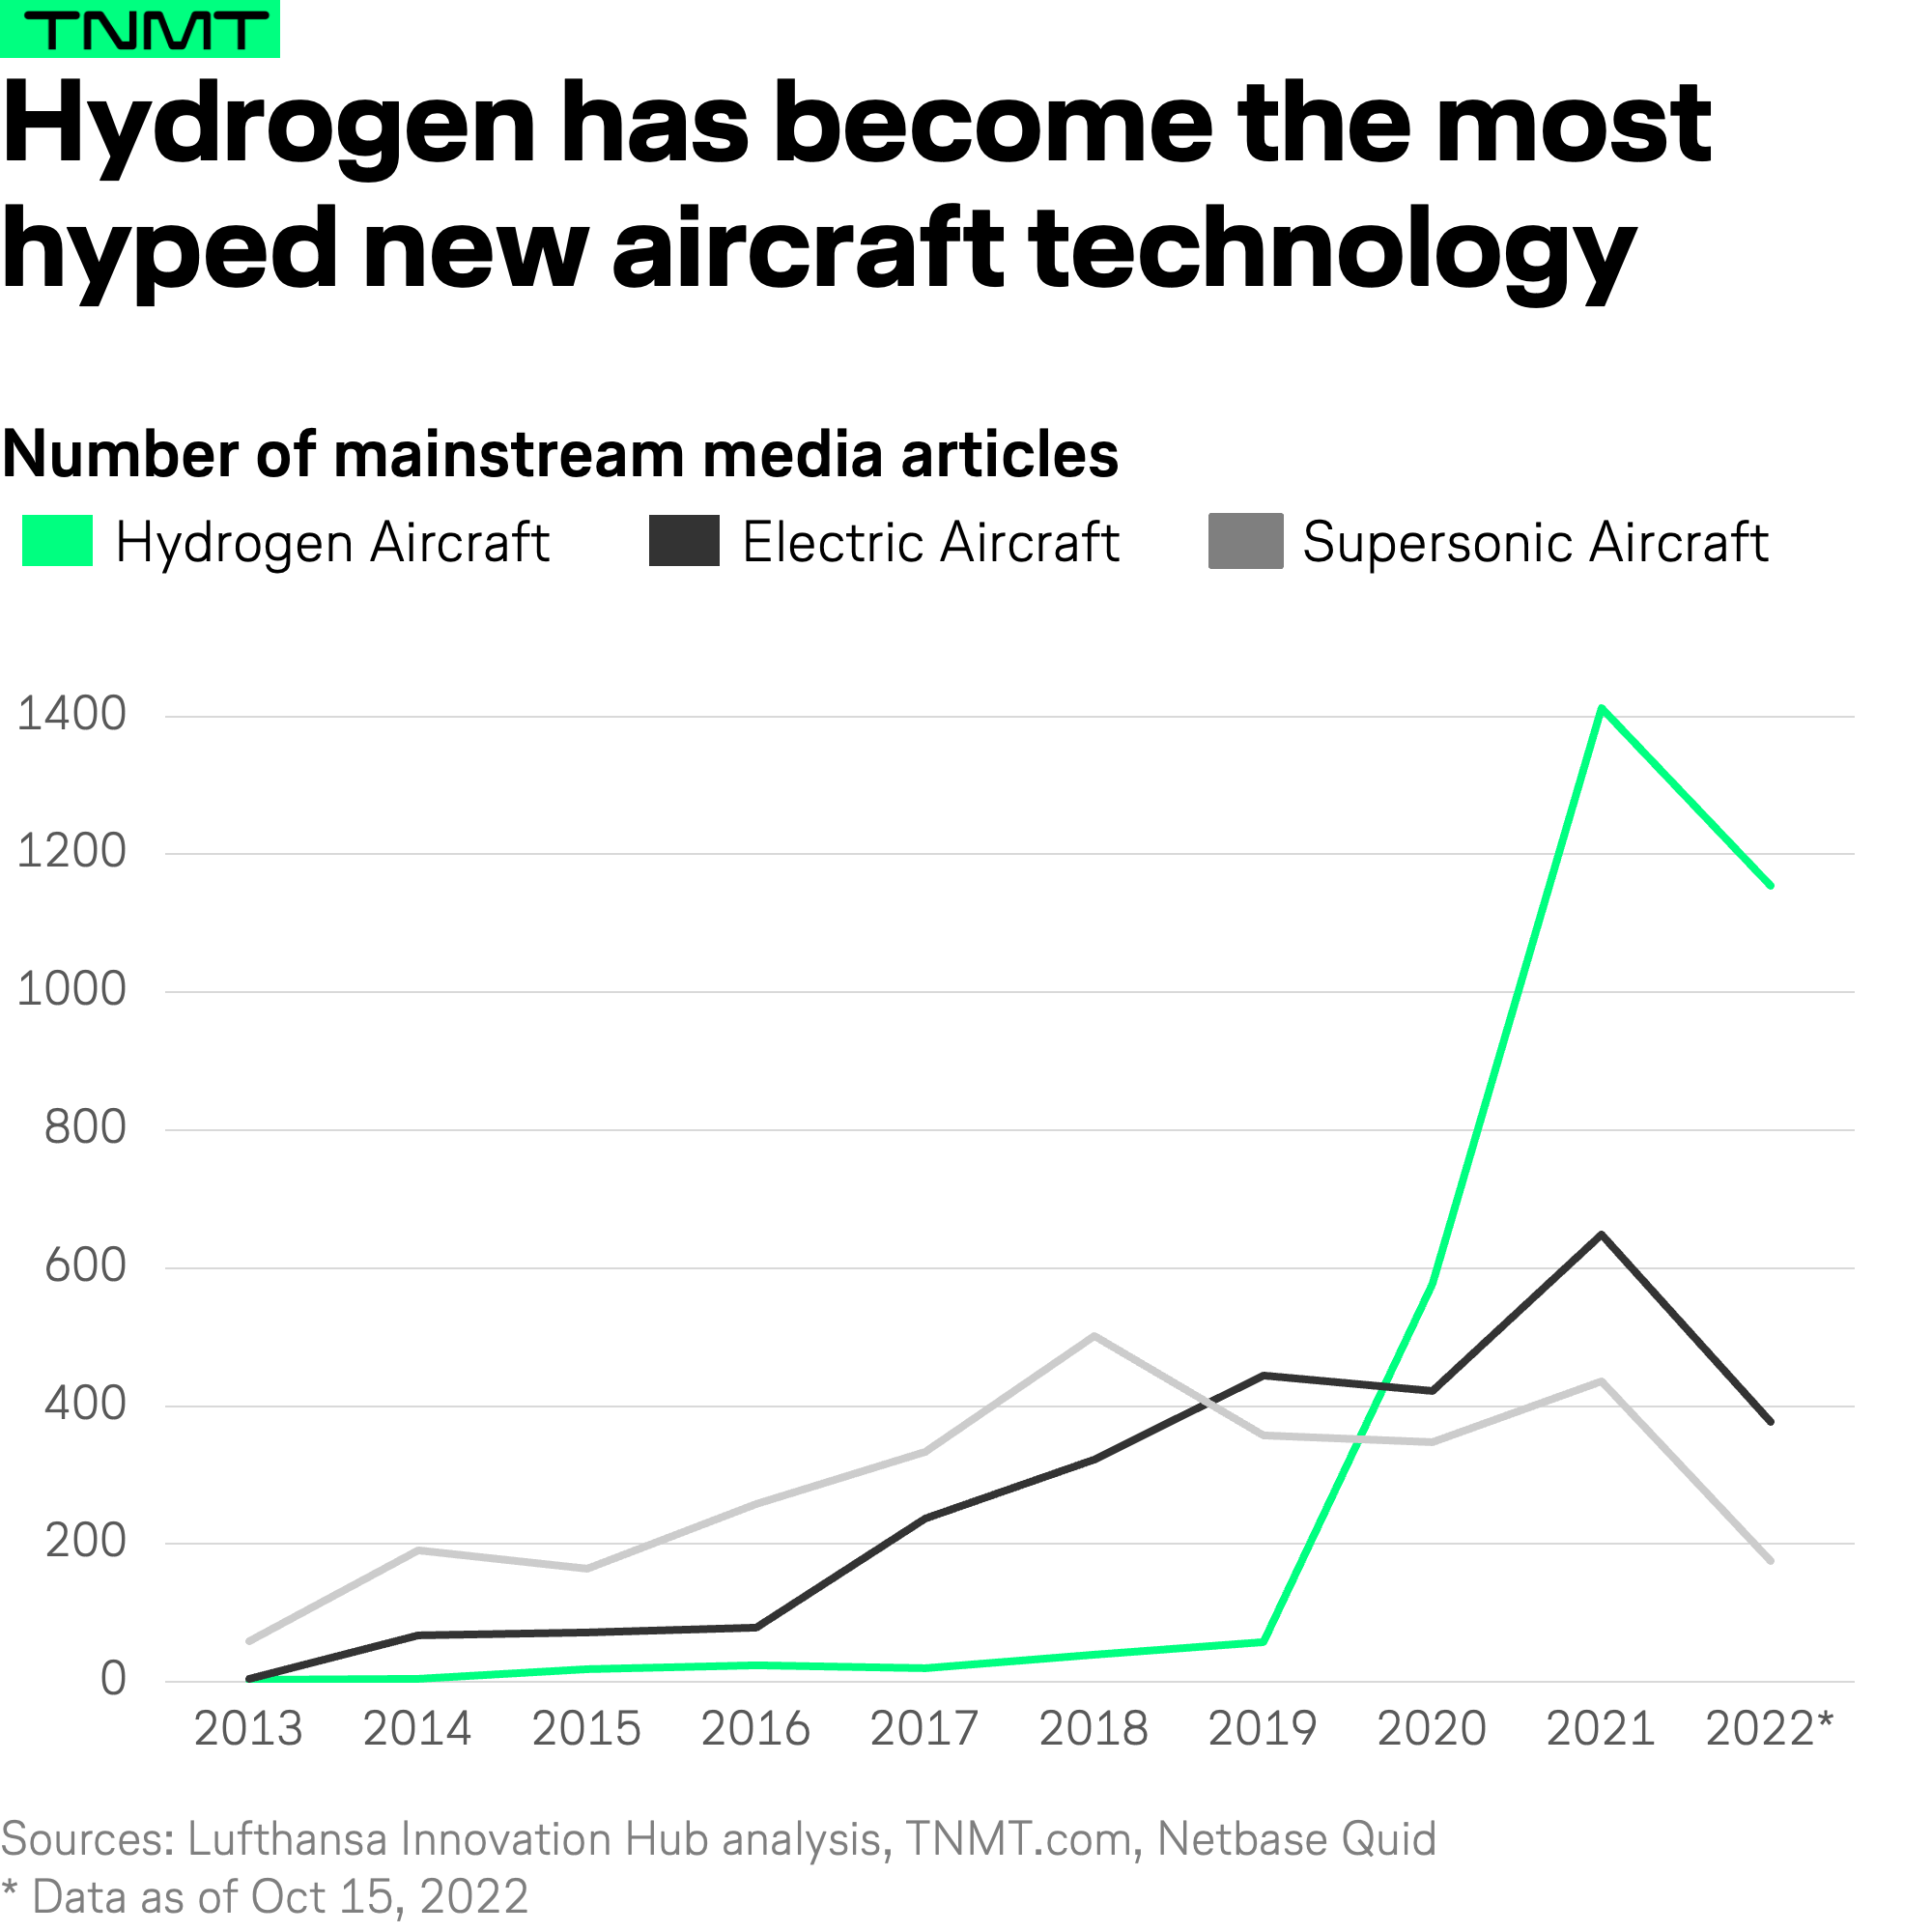
The frequency of news related to hydrogen aircraft have rapidly trended upwards since 2020.
How do airline executives perceive the current state of the aviation industry? To get a better sense, we analyzed the earnings calls of major airlines.
We analyzed airline investments into promising Green Aero Tech ventures working to minimize climate impacts from air travel.
In collaboration with Blackbox, we surveyed thousands of ASEAN travelers to learn more about their sustainable travel behavior post-pandemic.
A mapping of the leading sustainability startups, grouped by their estimated climate impact for a net-zero emissions future in the travel industry.
A modern-day mega-trend, sustainability is the most relevant commercial force of innovation shaping the travel and aviation sectors.